Overview & aim
In the digital education unit (DEU) at the vet school, we try to guide learning design to ensure all learning outcomes are considered when developing content. This is a data system design targeting online teaching/teaching delivery and content evaluation using Learning Outcome Mapping (LOM). It is imagined as an additional sub-system within the existing framework of a learning management system (LMS). Continuing from Theme 3, I reject temporal metrics as a useful measure for such a purpose.
This system is an attempt to provide course staff with an overview of potential strengths and weaknesses within their course content by mapping and comparing learning outcomes (LOs) to both assessments and course content. This is system would incorporate into existing instructional practices as a supplemental content efficacy review tool (Tsai, Perrotta and Gašević, 2020), in line with how a significant portion of instructors use dashboards to inform teaching delivery (Brown, 2020).
Instructor Example
MCQ 1 is completed and marks released. The instructor can view performance by learning outcome. They may see that LO2(a) scored particularly poorly across the cohort. The system could highlight content mapped to LO2(a) to allow further investigation of content quality in terms of clarity etc.
Secondary Aspect
Feedback and revision recommendations for students based on LOMs. Since the datafication legwork is already done through mapping, this could provide an avenue to improved learner agency if the recommended revision provided after assessment were accurate (Tsai, Perrotta and Gašević, 2020).
Student Example
Student completes MCQ. They scored 75% overall, but relatively poorly (50%) for LO1(b). The system could show this in a breakdown and recommend relevant course content to review LO1(b).
Dashboard Visualisations
Ideally the student dashboard would show an overview of assessment performance against each learning outcome and suggest content for review that aligns with required LOs. In doing so, it provides a modest level of personalised guided review. Instructor visualisations will forward the connection between assessment performance and matched (sub-)LOs and content at a cohort level. Assessment scores act as a proxy for learning outcome success through accurate mapping.
Data System Design
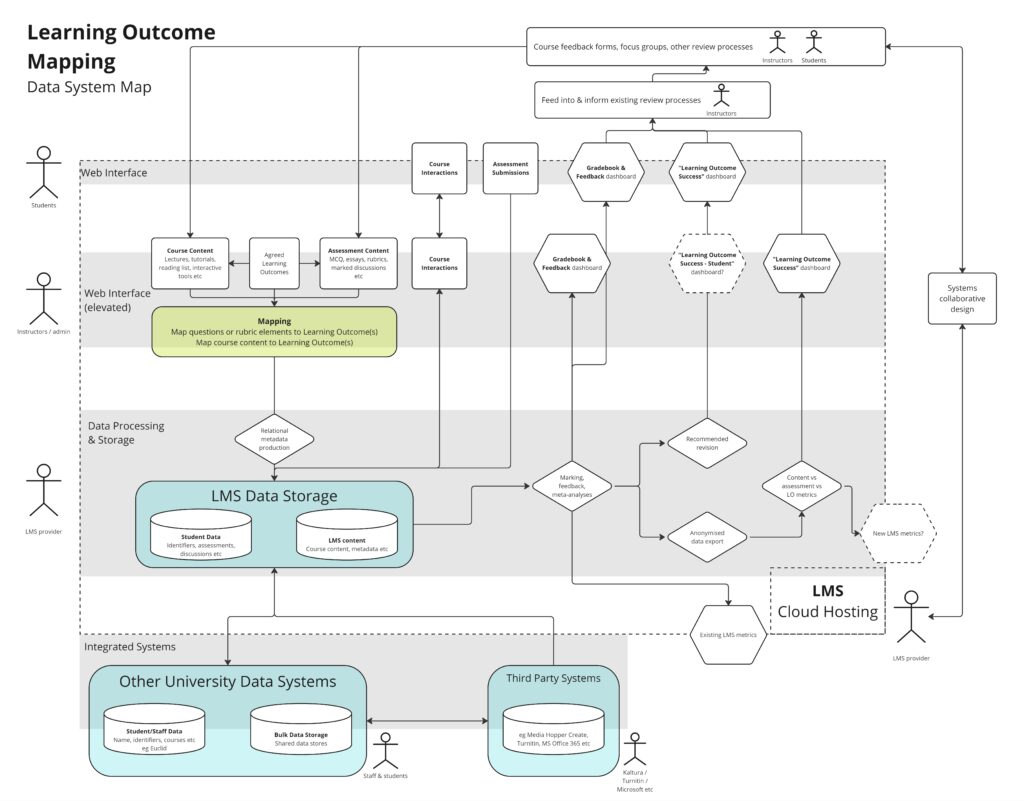
Learning Outcome Mapping – Data System Map (PDF)
Stakeholders/Actors
- Instructors (& support staff – admins DEU etc)
- Mapping – additional manual work to assign learning outcome to every piece of content and assessment question or rubric
- LO/course/programme dashboard view
- Students
- Submissions – data in the form of assessment submissions and interactions within course
- Personalised LO dashboard view
- Institution
- Ultimately responsible for the correct handling of student and staff data
- Senior staff (potentially) receive dashboard data
- LMS
- Assuming not self-hosted, LMS provider would be a data processor
- Provide the systems to process and store this data
- Likely some prerequisite of metrics-sharing
Data Collected
Specifically for the purpose of the LOM system, the following data is collected:
Student-produced data
- Assessment submissions
- Marked Discussion interactions within LMS
Instructor-produced data
- Course LOs
- Sub-categorised further than just learning outcomes?
- Assessment questions and rubrics
- Mapped to LOs
- Course content
- Mapped to LOs
- This would produce some relational LOM metadata within the LMS
Designing a non-predictive system to avoid potential reproduction of existing biases (Tsai, Perrotta and Gašević, 2020), I am instead attempting to provide some “empowerment” through an alternative view within a feedback mechanism.
Reflection
This model would require significant initial manual mapping work on the part of instructors that might not be seen or appreciated by other users or senior figures (Selwyn, 2021). This also runs us into an issue of data accuracy, where we approximate very nuanced details such as individual questions using very broad Learning Outcomes. It could result in a muddy model where everything is mapped to everything. Such a voluminous amount of manual work would likely result in errors, which would be hard to fix later. Together this could result in a lack of clarity or trust in such a system (Brown, 2020).
I made a conscious attempt to avoid contributing to the positive feedback loop of “market-making” for the sake of “market-competitivity” (Williamson, 2019), and instead attempt a holistic approach to actionable feedback for both students and instructors. I also feel I somewhat sidestep Williamson’s critique of metricizing performance of people, as it is instead measuring the performance of content in delivering learning outcomes to students (through assessment). This would hopefully feed positively into critical evaluation of course content by instructors – opening lines of enquiry, rather than be seen as a solution itself. It could however feed into an “audit culture” where a course or programme can be more readily measured by its success in delivering specific Learning Outcomes (Brown, Sowl and Steigleder, 2023).
Hartong and Förschler discuss the duality of data monitoring, and possibility of creating single centres of calculation (2019). I feel my model is heavily siloed, as it does not generate information that I feel would be relevant to institutional actors removed from the course or programme, whilst allowing for a new dimension of high-level overview of courses for instructors and students.
Brown makes a point about “greedy data” (2020), whereby insights are enabled through hosting everything on the LMS. However, in the case of online PGT at the vet school, this is already the case. It is also a solution that is class size agnostic, as the work is done against assessments and content as they are created, rather than on student output.
Here is a first draft of a data system map that became increasingly complex and was abandoned in favour of a simpler and hopefully more intuitive diagram:
References
Brown, M. (2020) ‘Seeing students at scale: how faculty in large lecture courses act upon learning analytics dashboard data’, Teaching in Higher Education, 25(4), pp. 384–400. Available at: https://doi.org/10.1080/13562517.2019.1698540.
Brown, M., Sowl, S. and Steigleder, K.M. (2023) ‘“May I Contribute Some Data to the Discussion?”: Negotiating Data Politics Through General Education Reform’, The Journal of Higher Education, 94(7), pp. 851–895. Available at: https://doi.org/10.1080/00221546.2023.2203629.
Hartong, S. and Förschler, A. (2019) ‘Opening the black box of data-based school monitoring: Data infrastructures, flows and practices in state education agencies’, Big Data & Society, 6(1). Available at: https://doi.org/10.1177/2053951719853311.
Selwyn, N. (2021) ‘The human labour of school data: exploring the production of digital data in schools’, Oxford Review of Education, 47(3), pp. 353–368. Available at: https://doi.org/10.1080/03054985.2020.1835628.
Tsai, Y.-S., Perrotta, C. and Gašević, D. (2020) ‘Empowering learners with personalised learning approaches? Agency, equity and transparency in the context of learning analytics’, Assessment & Evaluation in Higher Education, 45(4), pp. 554–567. Available at: https://doi.org/10.1080/02602938.2019.1676396.
Williamson, B. (2019) ‘Policy networks, performance metrics and platform markets: Charting the expanding data infrastructure of higher education’, British Journal of Educational Technology, 50(6), pp. 2794–2809. Available at: https://doi.org/10.1111/bjet.12849.


10 March 2025 at 17:06
Your blog is excellent again, Chris. Your visualisation and explanation perfectly meet the requirements. Not only is the sketch well-designed, but you have also included key insights from the course across the themes so far—different actors, their roles and potential risks, market-making, etc. You showcase the knowledge you’ve gained and include references. Your reflection is insightful. Well done. I don’t have much to say about your next (and last) visualisation except to keep up the good work.
I’d like to share a couple of thoughts about your visualisation that are not a critique but rather an engagement with your work. I agree that your proposed system is geared towards content rather than individuals and that this is, in many ways, better than the other way around. I also appreciate you elaborating on potential risks of your system. My first question is how would you guard against potential risks? For example, you mention that the system could lead to an audit culture (among other things). How do you think we can mitigate against this audit culture effect? What could we do? Would it be about the policy? Would it be giving the course tutor the right to delete all data? Something else?
My second question is about the changing nature of content and assessment. If we assume that learning outcomes (and sub-LOs) could be somewhat stable and would not change for some years, course content and assessment probably would. However, if your system measures these elements to provide a constant feedback loop, it probably needs stable elements. What happens when specific pieces of content assigned to specific LOs change every year? Or if pieces of assignments change? Does it matter for your system? Does it matter for the academic and teaching practice? What does it mean for the manual labour behind and the management of the ecosystem?
As before, there is no need to answer these questions; they are just for your reflection.
24 March 2025 at 14:32
Thanks Janja,
Those are some very interesting points to consider. In particular the friction between a dynamic, regularly updated curriculum and the likely need for a stable system for such an idea to flourish.