Mode elimination: taking the phases into account: 5
When I began this series of posts on the effects of phase, I had quite forgotten that I had once looked into the effects of phase in quite a specific way. This only came back to me when I was using my own book [1] to remind me about conditional averaging. And that book was published as recently as 2014!
In effect, McMillan and Ferziger tested the significance of taking phase into account as long ago as 1979, in the context of sub-grid modelling [2]. They did this by measuring correlations between exact sub-grid stresses and eddy viscosity models. In the case of the Smagorinsky model, which is widely used with reasonable success in shear flows, they found correlations as low as 0.1 – 0.2. Then, in 1998, McComb and Young [3] showed that, for isotropic turbulence at least, low values of the correlations between sub-grid stresses and eddy-viscosity models are due to phase effects. A brief pedagogical demonstration of the need to take phases into account in an eddy-viscosity model can be found in Section 8.7 of [1], but we will not pursue that here; but instead concentrate on the numerical demonstration of the effects of phase.
We carried out a numerical simulation of stationary, isotropic turbulence, with the velocity field in wavenumber defined on the interval  . Various cut-off wave numbers
  ,
,  ,
,  ; and so on, were considered, so that a series of large-eddy simulations could be compared to the fully resolved simulation. I discussed in my post of 23 March 2023 how the complex velocity field in wavenumber (a.k.a the Fourier transform of the real-space velocity field) could be separated into amplitude and phase; and this was the method employed in [3], from which I have taken three figures. In all cases, we evaluated a correlation coefficient
  and this is plotted against
  , where
  is the maximum resolved wavenumber in all cases.
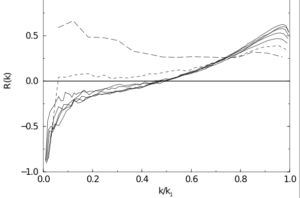
In Figure A, we show the correlation between the subgrid stresses and the eddy viscosity for seven cut-off wavenumbers in the range  with
with  . It can be seen that for most cases (shown by continuous lines) the correlation is not very good, varying from
  at the cut-off wavenumber to essentially being anti-correlated as
  . The exceptions are the curves for the lowest cut-off wavenumbers
  (long dashes) and
  (short dashes); and in particular the first of these. It should be noted that the first of these is the only one to yield a finite plateau region in the plot of the effective viscosity against wavenumber [3]. This latter property is an indication that it is only this lowest cut-off wavenumber which gives an adequate degree of scale separation compared to the maximum value.
FIG A
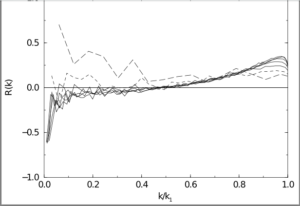
In Figure B, we show the phase correlations for the same cases, and the similarity to the results of Figure A are quite marked.
FIG B
On the other hand, the results for amplitude correlations in Figure C show a high level of correlation over the entire range of wavenumbers, with very little variation between the results for the various cut-off wavenumbers.
FIG C
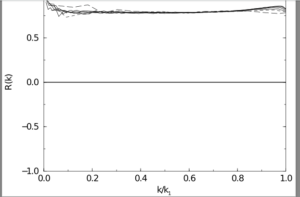
In this case, isotropic turbulence, we are mainly interested in modelling the inertial transfer through wavenumber and for this purpose a model which represents the amplitudes is quite effective. However, given that all such formulations are based on average quantities it is not easy to see how the phases can be taken into account.
[1] W. David McComb. Homogeneous, Isotropic Turbulence: Phenomenology, Renormalization and Statistical Closures. Oxford University Press, 2014.
[2] O. J. McMillan and J. H. Ferziger. Direct testing of subgrid-scale models. AIAA Journal, 17:1340, 1979.
[3] W. D. McComb and A. J. Young. Explicit-Scales Projections of the Partitioned Nonlinear Term in Direct Numerical Simulation of the Navier-Stokes Equation. Presented at 2nd Monte Verita Colloquium on Fundamental Problematic Issues in Turbulence: available at arXiv:physics/9806029 v1, 1998.