Residential Building Classification in Zimbabwe Using High Resolution Satellite Data
A blog post by Gareth Haagman of Exeter University who worked with the geospatia livelihoods group as a research experience placement intern as part of the SENSE CDT. In this post Gareth summarising some of the work he conducted on building classifications using 50 cm spatial resolution satellite data in Bulawayo, Zimbabwe.
Introduction
Bulawayo is the second largest city in Zimbabwe and consists of a mixture of both rural and urban areas. The most recent census (2012) places the population at approximately 650,000 residents, however there has been rapid growth in the area over the past decade so this estimate, along with other household surveys, are now effectively out of date for mapping and monitoring socioeconomic conditions. In the geospatial livelihoods group we are interested in the use of high resolution satellite imagery to supplement this lack of information in support of the Sustainable development goals (SDGS) especially SDG1.
Household survey data and field campaigns have indicated that certain features of residential buildings can often be correlated with wealth and poverty. For example, residential building size, roof material type have been found to be correlated with household wealth. Furthermore, we think that how densely packed buildings are could also be an indicator of local wealth and poverty. The approach I have taken to identifying this information has its basis in Object Based Image Analysis (OBIA). Firstly, we find buildings and combine those pixels contained within the building together to form ‘building objects’ in a process called segmentation, this allows us to find building size and housing density. From there we can then perform a classification to determine the roofing material from the image. This process is usually performed by a researcher who builds up a classifier slowly by interpreting the spectral data; however, this can be time consuming and often unable to accurately identify all buildings. Instead, a machine learning approach can be taken to segment and classify buildings.
Segmentation
Initially, I took a segmentation approach similar to the work of a previous project by Isaac Neal also working in the group. This was based on a Convolutional Neural Network (CNN) which is a typical algorithm used in computer vision to perform a segmentation. Upon further research I found a more novel approach based on the Vision Transformer architecture, an application of the Transformer typically used in the field of Natural Language Processing to image data. This had not previously been applied in an Earth Observation context, so instead of taking the typical approach I decided use a modified Transformer segmentation model called Segmenter[1]. The idea was for me to hand label images and utilise some semi-supervised learning methods to build up a training set that could produce an accurate model.
After some initial testing with this approach and around halfway through the 6-week internship, I discovered that Google had released its Open Buildings Dataset[2] which contains not just segmented buildings for Bulawayo but the entire continent of Africa. Their approach to segmentation used a CNN like that used by Isaac however with significantly more complexity and a remarkably large training data set (>2 million buildings). This was rather convenient and, given that the data produced was more accurate than that I could produce myself in the given time period, I decided to use a subset of the data which Google had provided. Freeing up time to work on the classification of building roof material types
Building Extraction
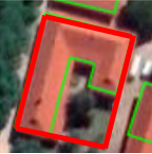
Before we can begin classifying the building segments they must first be extracted into individual images which shall be used to train the classifier. Currently the data we have is simply a collection of the building shapes and location which is overlayed onto an image. In order to train the classifier we must have individual images of each building which have to have a rectangular border that have been extracted from the basemap. This is what the polygons looks like overlayed onto the basemap:
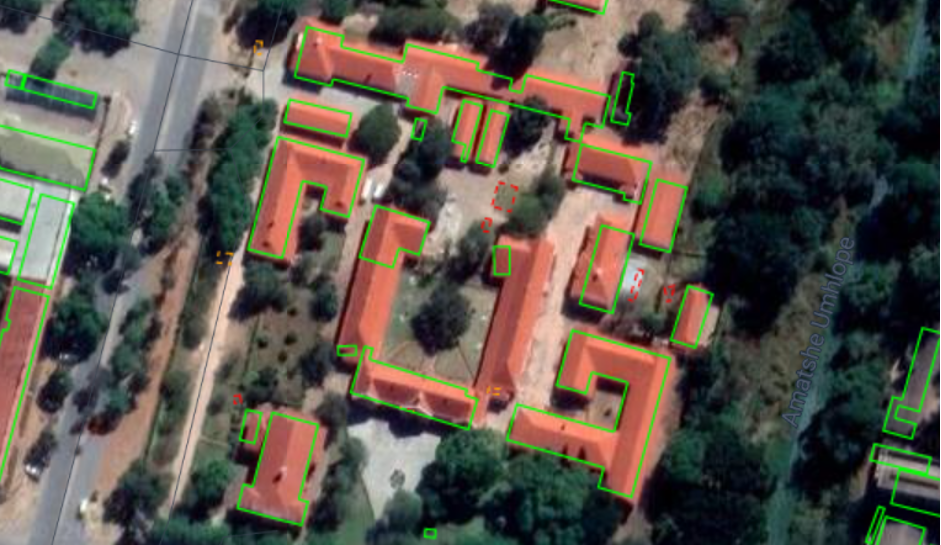
As we can see, some of the shapes are complex which cannot be directly extracted unlike some of the simple rectangular shaped buildings. My task was then to design an algorithm to extract these buildings. I decided that an approach, referred to as outline simplification, would be most suitable for our purposes. This works by extracting the minimum rectangle from the image as follows:

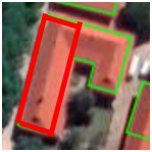
While this did cut off a large part of the building, a lot of the image is retained and no outside material (i.e. non building information) is retained.
Another approach is called least bounding box which works by including the minimum surrounding area in the image to form a rectangle as follows.
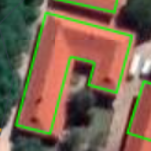
While this does include the entire building it now contains information which does not come from the building roof.
The outline simplification method is used to avoid confusing the model training with non-roof information. Even though less information is gathered by this method it is always roof data that is collected, presuming an accurate segment is used. It is also for this reason that I will also only use building segments with a confidence level >= 0.75 to perform the classifier training. The dataset from Google lets you filter by these confidence intervals already. This algorithm is currently under development in Python.
Classification
Once these images are extracted it is planned to use an unsupervised method such as clustering to divide roof types into groups. These resultant groups can then be labelled by roof type. The Geospatial Livelihoods team has contacts in Bulawayo who could help confirm the exact nature of these roof types which we so far assume to be asbestos, concrete, tile, steel and other such materials.
Using the data & final thoughts
All of this data could then be used as part of a multi-level statistical model to describe the poverty in Bulawayo. This also has the potential ability to predict how much the population has grown since the last census as well as other factors. The group has previously produced graphs of nearest time to medical facilities, schools and water sources – all of which could be updated with the addition of just the segmented data.
It was also suggested that a classifier for urban/rural areas be attempted using just the segmented data. By knowing just the housing size and shape (given that more urban housing is smaller, more regularly shaped and smaller than rural housing which tends to be more spread out and irregularly shaped) it may possible to determine this, which could highlight where some informal settlements have been set up as well as the size / approximate population densisty of the city.
[1] https://arxiv.org/abs/2105.05633
[2] https://sites.research.google/open-buildings/


Recent comments