This week I have been focusing on visualisations using ArcGIS Online and thinking of the best ways to make interesting visualisations. So far ArcGIS Online has been very easy to use with lots of different tools however, the visualisations have been more limited than the maps created on Leaflet.
Creating Choropleth Maps
I spent the start of the week tweaking my Accused Witches Residence Map that I created on ArcGIS Online to make the map visually pleasing and easy to understand. ArcGIS Online is a very good program for making visualisations without a knowledge of coding and I have really enjoyed using the program so far. Although, I have had some issues with making the maps in a style that is exactly how I want. Therefore, perhaps using coding could be the way forward in future map making on other projects.
Once I was happy with my residence map, I decided to explore choropleth maps. Choropleth maps are maps that can highlight the different numbers of something in specific geographical locations such as the population of each country when the darker the colour, the higher the population of the country.
I decided to try making my own choropleth map using ArcGIS Online by following a YouTube Tutorial. My first map was to understand the number of trials held in each authority (council areas). It would have been amazing to have a digitized map showing the historical 16th century boundaries but I could only find modern authority boundaries using the Ordnance Survey Boundary Line Map. Therefore, I had to locate the different geographical locations for the trials and work out what authority it would have taken place in.
I then added these numbers in as a CSV table and joined the table with the Boundary Line Map data. By combining these datasets it allowed for the trial numbers to be displayed on the map creating a colourful visualisation. From the map, it is clear that the Lothian area had the most trial cases (probably related to the fact that there were more accused witches in this area of Scotland.
See trial authority map here: http://arcg.is/OX4CT
Creating Parish Location Choropleth Maps
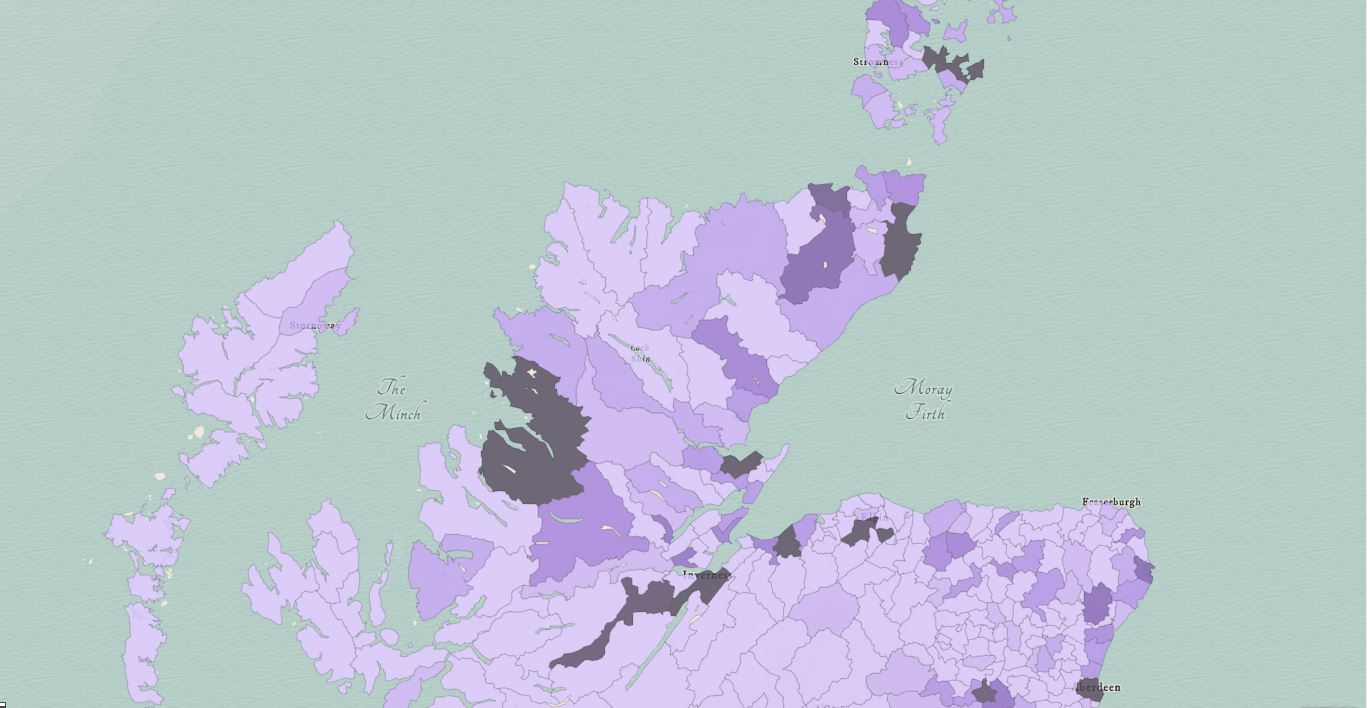
Once I had gotten the hang of choropleth maps, I decided to work on a more ambitious project of creating a choropleth map showing the accused witches residences within their parishes. I decided to go with the 1930’s National Records of Scotland parish boundary map as this was the most recent map that I could use for my map. I realise that a much earlier parish boundary map would be more accurate for recording the boundaries but the 1890’s parish map was the only earlier parish map which had been digitized and available for download. Although the 1890’s is earlier in time, is still very ahead of period from when the witchcraft accusations took place and so I thought that I would choose the modern parishes and carefully locate the parish for each residence.
As the parish boundary data had both names and number codes for each boundary I used the identical name and code for each residence parish. By having matching names and codes, it allowed for a much more successful joining of data between the CSV table of residences in each parish that I created and the National Records of Scotland parish boundary map.
See residences of accused witches in each parish here: http://arcg.is/11bvy1
Leaflet Map and Website
While I have been trying to make my visualisations on ArcGIS Online, Richard Lawson has been kindly working on creating another visualisation of the witchcraft data using Leaflet. Leaflet can be used to create web based maps using Javascript which can then be displayed onto a website. These maps are able to show the same geographical information as ArcGIS Online but there is a lot more freedom to create maps a preferred way with features such as timelines, clustering and clearer icon use. The Leaflet Map also connects directly with a Wikidata Query, meaning that when the data is updated on Wikidata it can also be changed on the map.
All of the visualisations, both mine and Richards’, will then be added to Information Services very own witches website! The website is still being developed with some more visualisations planning on being added as they are created.
The next few weeks seem very tight with time with only three weeks left of the project. I plan to spend a week editing the data, a week making visualisations and then my final week working on my seminar presentation.
There will be a seminar related to the Witchcraft project during my internship on the 11th of September and everyone is welcome to join. See event page here: https://www.eventbrite.co.uk/e/the-wicked-findings-of-the-witchfinder-general-using-linked-open-data-to-put-accused-witches-on-the-tickets-65177519716


Leave a Reply