Corona Testing on Twitter workshop report 22–23 June – Shona Lee
How can Twitter data be used to “tease out” relational figurations of testing beyond the laboratory?
#Locations #Devices #Relations:‘Corona Testing on Twitter’ workshop report 22–23 June.
Written by Shona Lee, DiaDev Research Fellow.
Over 22–23 June, in collaboration with King’s College London Department of Digital Humanities and the Public Data Lab, the Centre for Interdisciplinary Methodologies convened a two-day online workshop, ‘Corona Testing on Twitter: Surfacing testing situations beyond the laboratory’, to collaboratively analyse Twitter data and facilitate a dialogue about the social life of Covid-19.
As a research fellow with the DiaDev project (investigating diagnostic devices in global health) at the University of Edinburgh, I signed up for the workshop just as we embarked on launching our rapid research project Testing and Trust, a qualitative study examining the social value of COVID-19 testing and public trust in the pandemic response in Scotland. Having recently adapted our own methods to digital platforms, the workshop came as a timely and welcome opportunity to reflect on research approaches, and learn from experienced colleagues long adept to digital methods before they became the unexpected centrepiece of our daily working lives.
The workshop invited participants to contribute to two days of collaborative research to reveal, or ‘surface’ the multiplicity of COVID-19 testing situations that arise and unfold outside of the laboratory environment. Our trove, a vast database of over 75 million tweets captured using T-CAT, was compiled by the CIM Academic Technology team since the end of April 2020. While querying and sifting through the kinds of testing situations described on Twitter was one objective, another would be testing the kinds of articulations made possible, and shaped by the Twitter architecture. As prominent voice on the Coronavirus pandemic on Twitter, KCL’s Carlo Caduff commented recently on the appearances and expressions of judgement facilitated through Twitter:
“In Twitter, life assumes a particular form of appearance: an ongoing series of events in search of a caption. People are commenting online about things that occur in their life or in the world […] People bear witness, express themselves, and let other people know whether they agree with something or not — or how they think about it — and that frequently takes the form of an opinion or a judgment” (Caduff and Bonilla, 2020).
Tweets as expressions of judgement, it turns out, would be a key observation and point of discussion across our parallel forums of analysis. Caduff remarks that Twitter’s limitations as a mode of communication can limit our critical analysis of its content, in that it “reduces critique to the idea of judgment, rather than seeing critique as something that is about conditions of possibility.” Dr Jonathan Gray’s workshop presentation on ‘curating datasets and environments of interpretation’ was perhaps more optimistic in this respect, encouraging us to consider the utility of tweets in the context of critical analytics to elicit conversations and “surface a more diverse ecology of practices and conceptions of testing in society”. Finishing with the interesting etymology of the word ‘tease’ (pluck, pull, tear; pull apart, comb fibres of wool etc.), he described a process of “teasing out” relational figurations of testing from the data. The tactility and associations of this analogy stayed with me throughout our activities.
We were also encouraged to undertake detailed ‘collective note taking’ to explore the possibilities of different styles of data analysis, documenting our process and progress, the breakthroughs and frictions that arose from our individual and collective experiments. To facilitate this curation, organisers established collaborative environments across multiple modes of communication and recording: Zoom breakout chat rooms, google doc diaries, slack channels and presentation slides — each assembling and compiling an inventory of collective discussion points, reflections, data drops and visualisations from our respective working groups’ excavations. Each group has a Slack channel to post links to document folders, datasets, images, and questions.
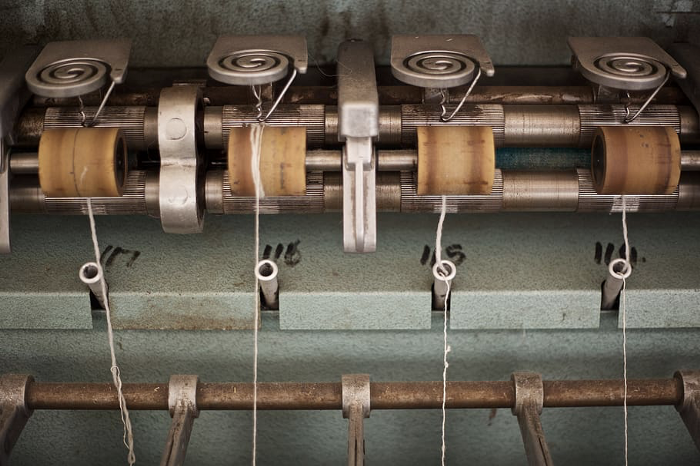
The #anecdotal-situations Slack channel created a space for sharing testing situations outside of our dataset. I was intrigued how this post depicted how ‘critical testing infrastructures’ take shape in rural settings.
The Zoom platform would be our digital meeting place, with the format emulating the physical workshop in its agenda and group work structure. Simple gestures became familiar and comforting reference points we could draw in our new socially distant working environment. One of the organisers volunteered to be our ‘roving’ facilitator, monitoring each group’s Slack channels and responding to questions and providing technical support where needed. When re-joining the main call ‘room’ after breakout sessions, participants found themselves transplanted into other groups’ overlapping discussions. Someone jestingly remarked how these abrupt re-entries into shared digital spaces were not unlike returning for a plenary in our more familiar face-to-face workshop, where “there is always that one group” running over time and taking over the lecture hall, while others filter in with their own unfinished conversations.
The workshop began with a round of engaging and accessible presentations from Professor Noortje Marres and Dr Jonathan Gray introducing the concept note framing the theoretical framework and questions for the workshop (helpfully illustrated with key readings and examples from our dataset).
What type of testing situations can be surfaced through an interpretative analysis testing on Twitter?
What can this tell us about the ways in which Corona testing puts social relations, and society, to the test?
Dr James Tripp’s informative introduction to the T-CAT dataset explained how the large dataset were made more manageable by creating three subsets, or ‘bins’, and allocating them to different groups to analyse over the course of the workshop. These would allow us to split up and explore the data in more depth around three topics, or ‘situations’ of testing, and the primary methods each group would be testing:
┌────────┬──────────┬─────────┬─────────────────┐
│ Topic  │ Location │ Devices │ Relations       │
│ Method │ Lexicon  │ Images  │ Topic Modelling │
└────────┴──────────┴─────────┴─────────────────┘
After a fascinating round of presentations from group facilitators on the topics and methods involved, I opted to join the ‘Relations’ work group.
Topic Modelling #Relations
Topic Modelling is a type of data mining technique that uses “unsupervised” learning algorithms to scan and extract (or tease?) ‘hidden’ topics from large volumes of text. The topic model then produces probabilistic maps of topics, or collections of words, that are semantically related under a theme. The first day’s afternoon session primarily focused on gaining some familiarity with the capabilities and limitations of the Topic Modelling tool. Three further topic queries were created from the Relations query dataset:
Query-1: family OR granddad OR grandfather OR grandma OR grandmother OR grandpa OR granny OR mother OR mum
Query-2: boyfriend OR girlfriend OR husband OR wife OR partner
Query-3: society OR state OR community OR nation OR divide
For our fellow ‘Relations’ group members, the sub-queries relating to family members and partners presented an opportunity to explore situations of domestic violence. For others, behavioural or moral situations expressed through hashtags such as #COVIDIOTS could potentially reveal how Twitter can be used as a medium for social policing and passing moral judgement on others. My own interests piqued at the mention of a sub-query on state and society relations, which I hoped might surface situations of institutional trust and biological citizenship conferred by testing.
Individual examination of each subset in our bin to draw out prominent or surprising terms as an exercise to understand topics. By interrogating the groups of words that appeared closely together on each topic, through both ‘distant’ and ‘close’ reading of tweets, we were able to identify overarching situations elicited by the keywords (e.g. waiting for a test) which opened further avenues of investigation and narrow the queries to re-run back to T-CAT. Our ‘Topic Modelling Experiments’ folder became the ledger for this iterative exercise.
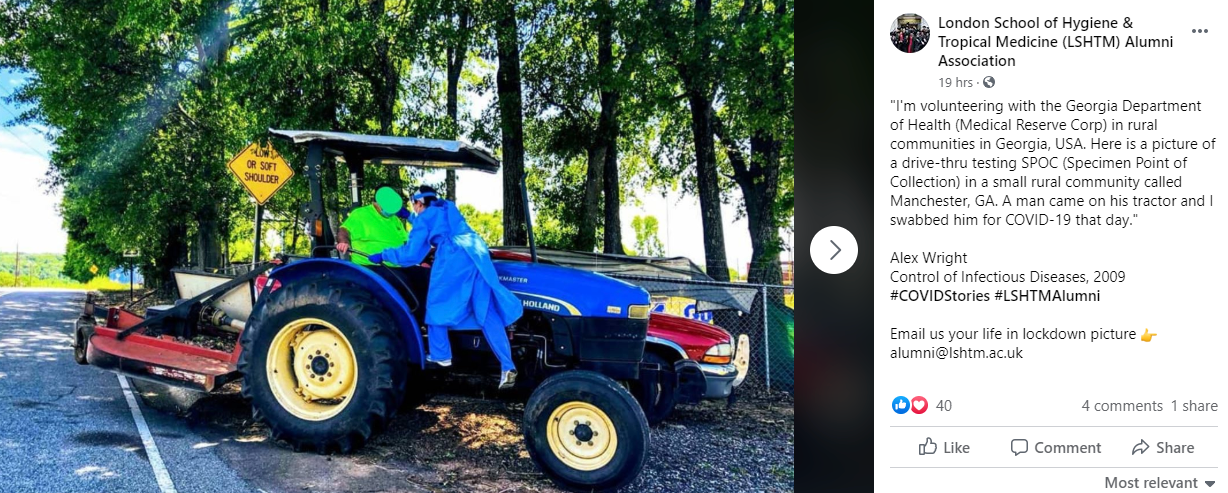
The Topic Modelling API interface displays words grouped closely in relation to each other. Each topic (circle on the left) broke these groupings down (bars on the right).
This zooming in and out, from the ‘distant’ to ‘close’ reading of data epitomised for me the processual ‘teasing out’ of data; as a collaborative attempt to not just comb through and map these situational ‘webs’, but to identify and contest what “counts” as a situation when analysing Twitter data. Documenting what counts in this collaborative note taking process, as well as what is discounted helps us to think about how our interpretive readings can shape the data we co-produce (in this case running new queries and subsets), or as one participant raised, “what do we do with what’s missing?”
We found topic modelling an excellent way to situate analysis on the level of expression and frequency, using other methods such as word trees used to visualise word frequency and roots.
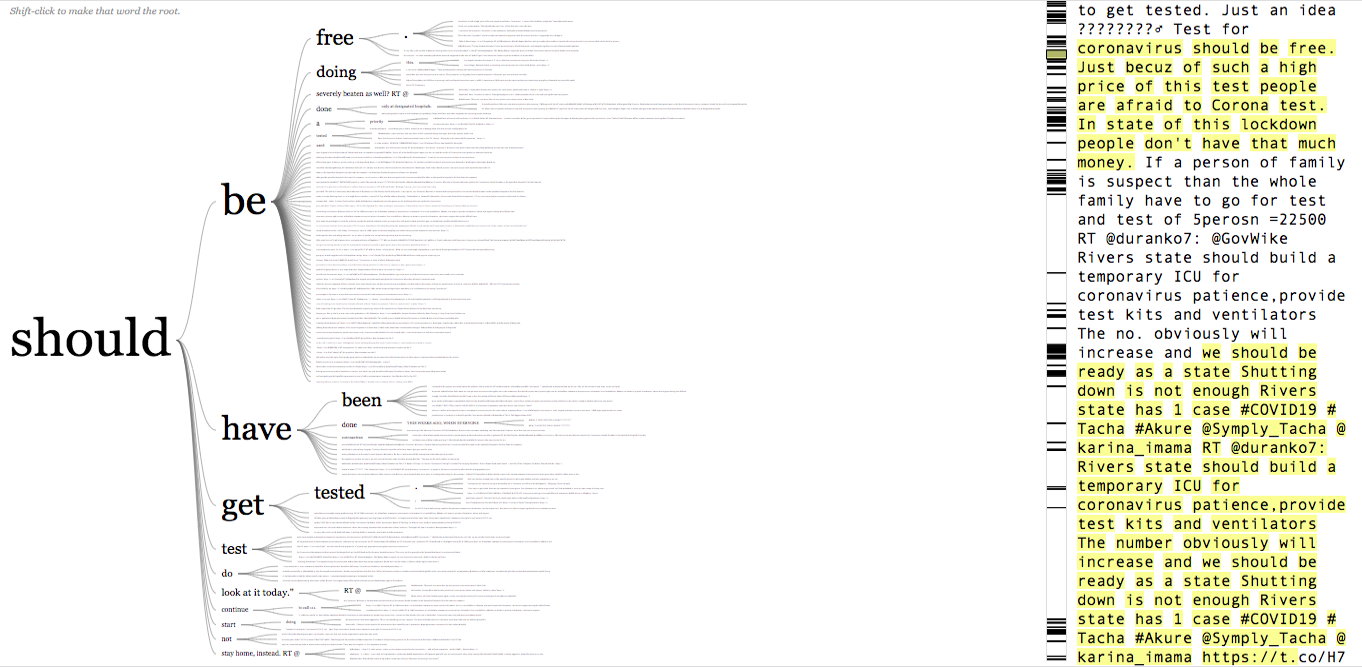
Word tree from judgement term ‘should’, created by Jason Davies (https://www.jasondavies.com/wordtree/)
In terms of technical limitations, the algorithm typically scans large documents, and as we analysed tweets as individual distinct documents in the data set (rather than collated into one large document), this could lead to a certain amount of noise. For example, we found retweets created some distortion and topics to cluster around particular news stories. These tensions highlighted both the strengths and limitations of topic modelling; while the interface could not necessarily facilitate a close critical analysis of tweets, considering the sheer size of the dataset at hand it was extremely useful in signposting and directing avenues of in-depth investigation. By mapping out possible situations, we could then use other methods, such as image grids or word trees as ways to further explore probable situations.
Teasing the Magic from the Machine
When we were transported and re-assembled one last time into our virtual lecture hall on the second day, each group presented the fruits of their experimentations. Our respondent Christian Nold then wrapped up the workshop thoughtfully by reflecting on whether there was something ‘natively digital’ in the ‘magic of the machine’. Is it the process of interpretive discovery and returning to the data, where human researchers bring sociological understanding to terms found by the algorithm, or the nature of these online methods that makes digital collaboration among researchers plausible and smooth that makes them truly digitally native?
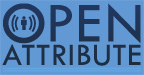
As for my own take away from our online workshop experience, tugging on the thread of Jonathan Gray’s analogy I’m reminded of a visit some years ago to Knockando Woollen Mill in northern Scotland. Alongside the modern working machinery, the mill houses an impressive display of original Victorian mechanical teasel gigs that semi-automated the artisan practice of refining wool since local farmers brought their fleeces for yarning 230 years ago. While these seemingly complicated machines appear to produce patterns merely through repetitive automated motions under instruction, their magic is in the close attention of their operators that know their limitations intimately enough to work creatively within them.
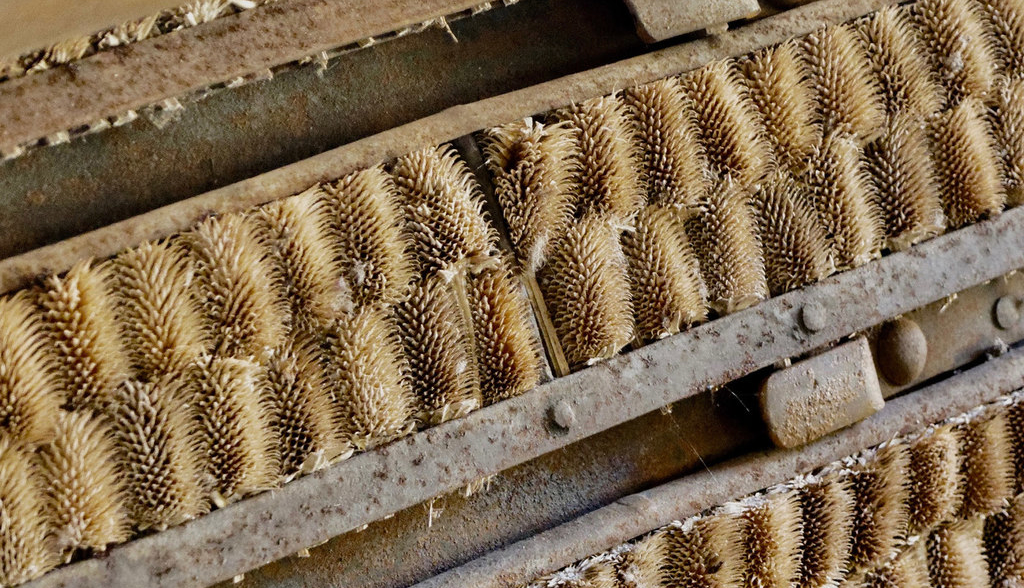
Teasels at Knockando Woollen Mill, Scotland. Photo © Julian Paren (cc-by-sa/2.0).
As we adapt to a rapidly evolving research landscape with new technological possibilities, I think on the magic to be found in digital tools and datasets like Twitter. Over the course of the workshop I gained a superficial understanding of what these can offer, and a renewed appreciation of the expertise of researchers who hone and share their craft so that the knowledge we weave can be teased apart and re-traced, to reveal both what is counted and what is missing. It is perhaps not only the surfacing of situations that Twitter data can facilitate, but the texture, or surface of data; the clusters, trees, clouds, and graphs that digital tools can shape the Twittersphere landscape into and gesture to conditions of possibility. Tweets can be “a kind of public notebook […] orientations, diagnostic, or suggestions for another politics of life” (Caduff and Bonilla, 2020), which can be used as departure points to elicit conversations about Covid testing and society. In our group’s experience using topic modelling, they can even articulate different ways of starting such conservations. Some of the conversations elicited during this workshop will continue at the DMI Summer School, and through collaborative publications. I have certainly taken away a great deal from these conversations and research approaches to inform my own work on COVID-19 testing beyond the laboratory.
Dr Shona Lee is a Medical Anthropologist and Postdoctoral Research Fellow at the University of Edinburgh. She works on the EU funded DiaDev project, where she is currently leading the project Testing and Trust (‘Building trust in a global pandemic: Public perceptions, expectations and experiences of COVID-19 testing in Lothian, Scotland’) funded by the Chief Scientist Office’s Rapid Research in Covid -19 programme.
The author wishes to thank the organisers and participants for delivering an engaging workshop and supportive working environment in challenging times.
Originally published on University of Warwick Centre for Interdisciplinary Methodologies (CIM) website https://medium.com/@warwickcim/locations-devices-relations-corona-testing-on-twitter-workshop-report-22-23-june-9953b83f4871