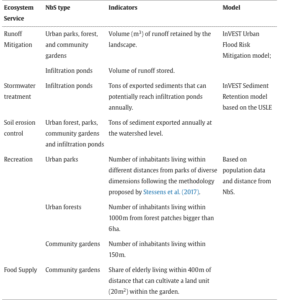
Unprecedented urban growth and extensive land-use change (including in peri-urban areas), especially in the Global South, have raised the alarming needs for urban ecosystem services. Longato and colleagues (2023) shared a selected list of NbS types and descriptions to suit the study area needs. Building upon that, a study conducted by Ortiz, M. S., and Geneletti, D. (2023) shows ES, NbS type, indicator of measurement, and tools to model or quantify that focuses on runoff mitigation, stormwater treatment, soil erosion control, recreation, and food supply.
Table 1. ES, NbS type, indicator, and modeling approach by Ortiz, M. S., and Geneletti, D. (2023).
However, having green infrastructure alone doesn’t guarantee the effectiveness of ecosystem services perceived. Figure 1 below shows that the park temperature can be reduced by implementing biophilic designs. With the projection of climate change, the area is relatively prone to the urban heat island effect.
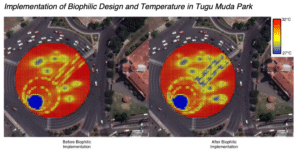
Figure 1. The biophilic design model can alter the park temperature (source: Ristianti et al., 2023).
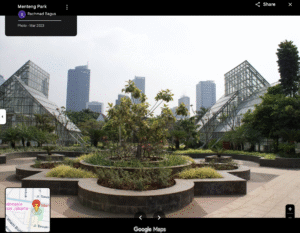
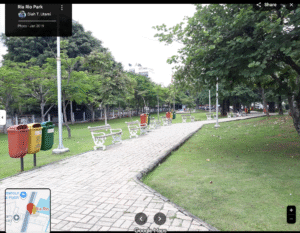
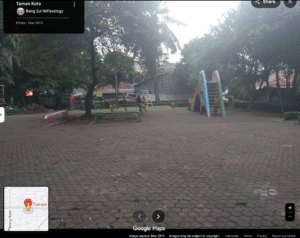
Figure 2. Several park photos by visitors (Menteng Park, Ria Rio Park, Taman Kota) (source: Google Maps)
From Figure 2 and according to my personal observation living in Jakarta, the comparison between green vs. grey infrastructure in urban parks is not yet standardized. Making me wonder, besides the underachievement of the overall green space target (30% of Jakarta), does the current design have to be criticized? Referring to Figure 1, “biophilic” is relatively new in the Indonesian context. Hence, limited research has studied this concept in Indonesia. Aside from biophilic design, there are also sustainable and regenerative design frameworks used by designers and architects in the adaptation to and mitigation of climate change, resource depletion, and declining environmental quality in cities.
Table 2. Different dimensions from sustainable, biophilic, regenerative design frameworks (source: Biophilic Innovations, 2025)

Guo and colleagues (2023) studied the influencing factors of the park cooling effect from the endogenous and exogenous factors. Endogenous factors include park perimeter, area, built-up area, green space, water bodies, NDVI, tree heights, and others. While exogenous factors include the park’s surrounding areas, landscape, and density.
Modeling and Quantifying ES provided by Urban Parks
Aligned with the interest of the Millennium Ecosystem Assessment (MA) which is to analyze and, as much as possible, quantify the importance of ecosystems to human well-being. This exercise’s overarching goal is to make better decisions regarding sustainable use and management of ecosystem services. Below are several ways to quantify ES provided by urban parks, as several studies have performed:
- Urban InVEST features spatially explicit biophysical and socio-economic models that enable users to quantify and map the impacts of alternative urban designs on multiple urban ecosystem services (e.g., urban water management, heat island mitigation, and mental health benefits), showing the benefits and costs to communities by socioeconomic status and vulnerability. InVEST has several models to measure urban ES such as Urban Cooling, Urban Flood Risk Mitigation, Urban Nature Access, and Urban Stormwater Retention.
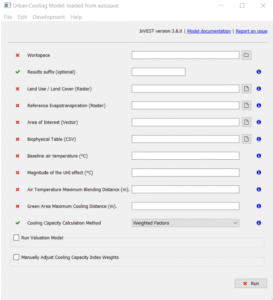
Figure 3. Data required to quantify urban cooling models using URBAN InVEST.
- i-Tree is a tool for assessing and managing community trees & forests. Aimed at providing free, easy-to-access, informed technical data to produce strategic management, planning, and policy. It combines field data and internationally available data to compile trees’ & forests’ structure, function, and value.
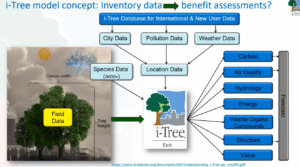
Figure 4. i-Tree modeling concept from inventory data to benefit assessments.
- Costs and Benefits: Willingness-To-Accept (WTA) and Willingness-To-Pay (WTP)
The concept is built upon an assumption: if people really care or suffer from environmental nuisances, they should be willing to abandon a certain amount of money or income to decrease the level of these nuisances (Sustainable Transportation and Smart Logistics: Decision-Making Models and Solutions, 2019). An example of using this theory is a study by Hippy et al. (2024) analyzing visitors’ willingness to preserve the environment at Kurenai Beach, Sulawesi, Indonesia.
4. Assigning ES demand scores to potential NbS sites
Besides quantifying the ES value, understanding the demand and potential of the landscape is also important. Following the approach proposed by Cortinovis and Geneletti (2020), the demand for each ES is defined by two factors: i) the intensity of the hazard (for regulating services) or level of deprivation (for recreation) and ii) the number of people or physical assets that are exposed to that condition.



Leave a Reply