To play around with some sample ideas, I created work out of paper and on procreate.
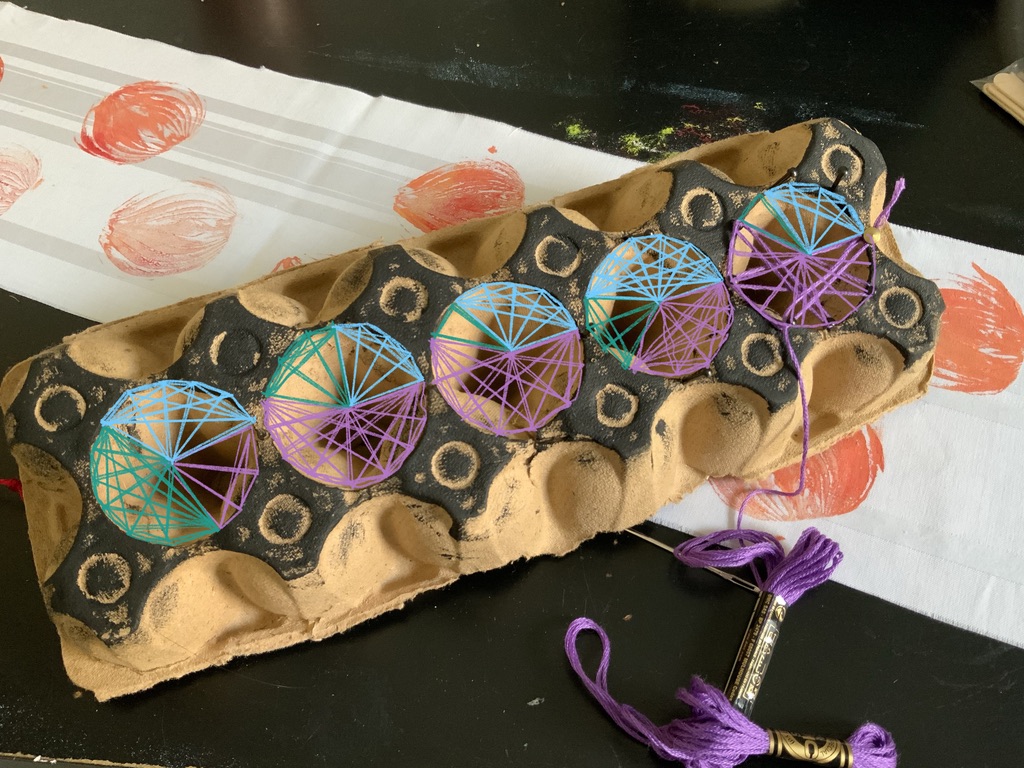
Pie chart construction out of thread and egg carton
I wanted to to use items related to food to link some of my samples back to my theme. My first sample shows data from questions 1-5 in the form of pie charts. I used an egg carton, thread and nails however, did not have enough nails for this sample so I created the finish piece digitally to show how the thread would be used to create these pie charts.
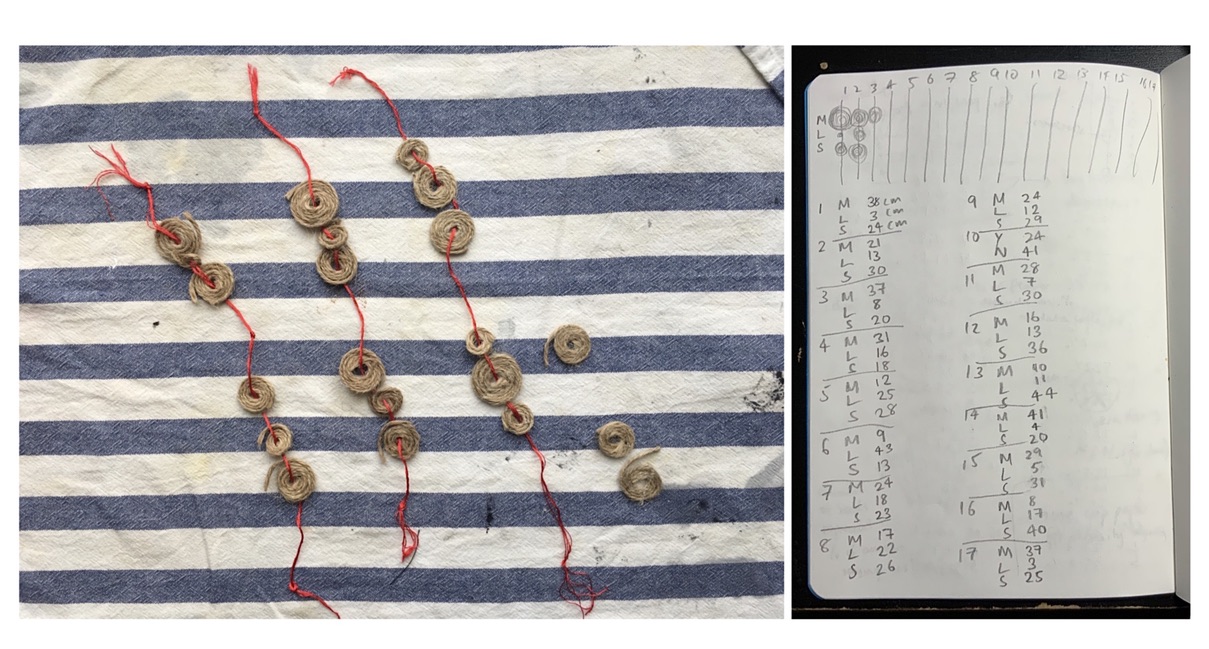
Rope coils on thread to represent data
My second sample uses thread and rope coils and a kitchen towel as the background. The strands of thread represent the questions and each group of 3 rope coils represent a set of answers in order of ‘more’, ’less’, ‘same’. The length (in cm) of rope used for each coil is based on the total number of people who answered the same.
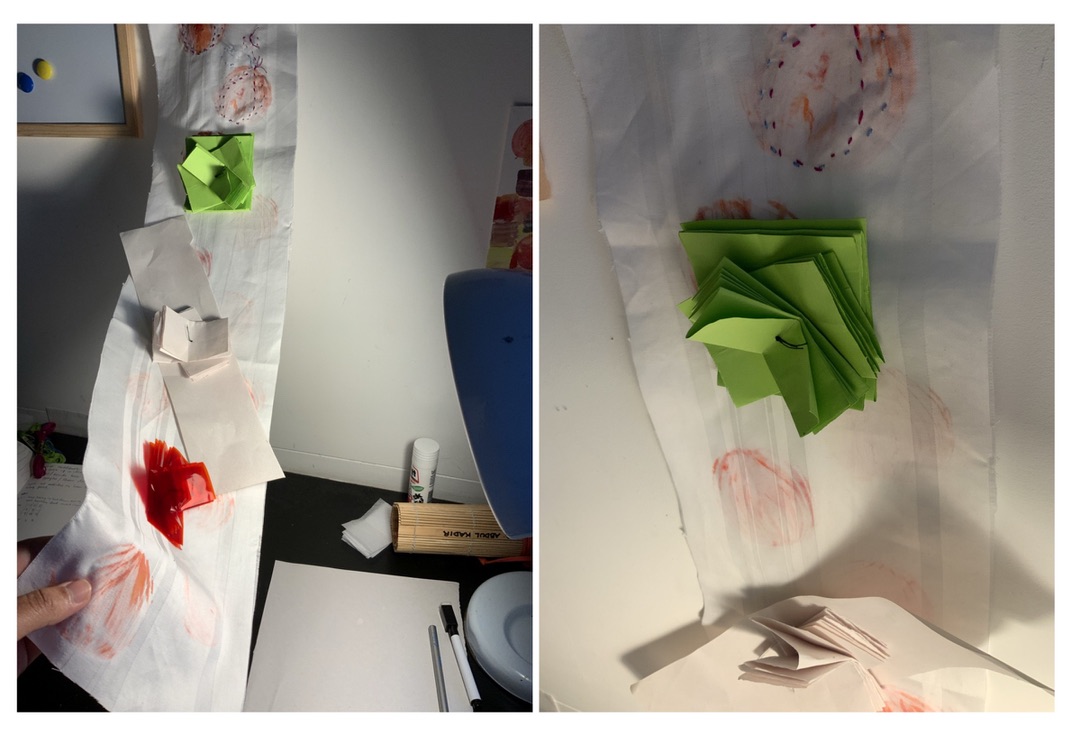
Paper and cellophane on fabric to represent data
My third sample shows data from question 2. the green paper at the top represents those who answered ‘more’. the first layer of green paper has been folded 12 times. Each fold is based on the number of teenagers who answered ‘more’. The second layer representing young adults, folded 6 times and the bottom layer representing adults is folded 3 times. I repeated this process for the other 2 sets of layers. The news print representing those who answered less and the red cellophane at the bottom representing those who answered ‘same’.
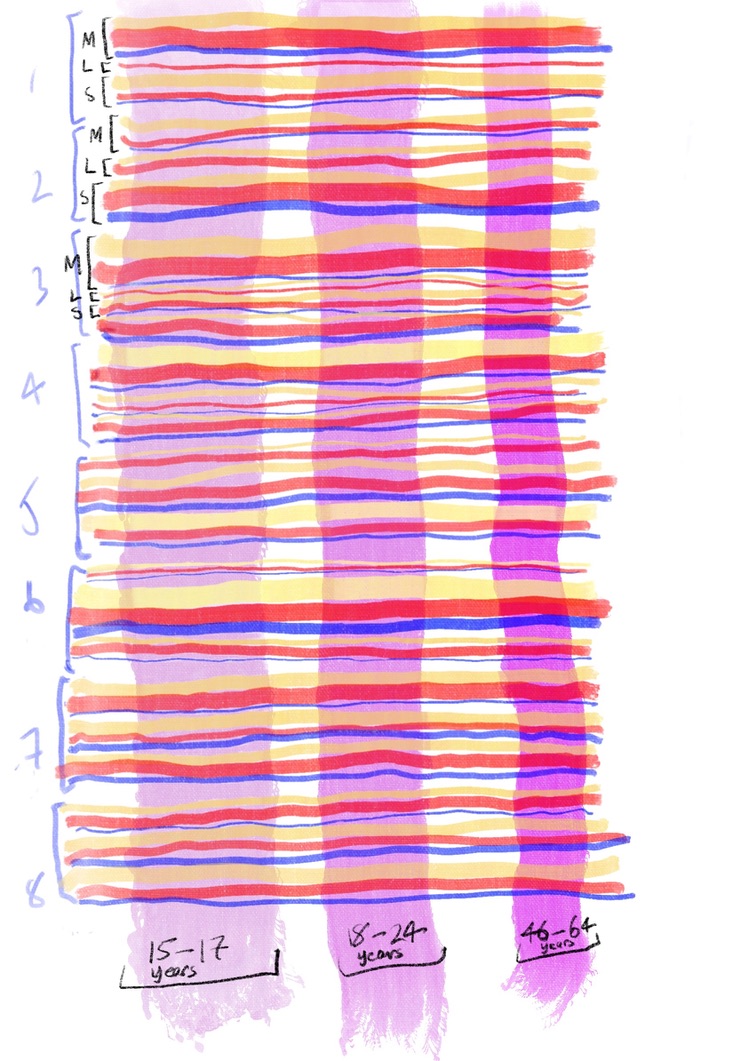
Digital weave idea to represent data
A digital drawing of my initial weave sample. The thickness of horizontal weaves was changed by the brush stroke percentage on procreate while the brush stroke percentage equates to the total number of the same answer from each age group. This sample focuses on the data collected from the survey as a whole and would have resulted in a very dense and complex weave which I didn’t have the right materials for to test as a practical sample. However, I narrowed my focus down to one question to study the data in depth.


lrichar3
Your connection between the drawings and graphs to communicate the data gathered and the practical investigation with materials is so clear in this post. The initial paper and fabrics combination to explore the 3D nature of your experimental “drawing” works so well as a bridge between drawing and textile sampling. Looking forward to seeing this approach to drawing and design development blossom in future projects.