
Introduction
Data is a powerful and persuasive tool, influencing learning from personalised Duolingo study all the way to national educational policy (Williamson, 2019). The four thematic blog posts mark a path that wades progressively deeper into the understanding and conceptualisation of data within the context of higher education.
Constructing data in education
I began with a relatively superficial look at Constructing Data. This construction (figure 1) required me to consider a facet of my life that I wished to measure and visualise and determine the data to be collected to bring this to life. Kühne’s description of such a data system (2005) – mapping (models are abstractions of an original), reduction (models only represent select parts of a system), and pragmatics (models represent the system for a specific purpose) resonated as a reflection of my personal perspective on data as an inherently imperfect representation of reality.
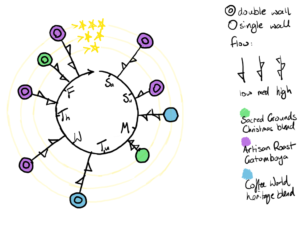
Figure 1: Weekly wheel of coffee
Turning this perspective towards my role in higher education, we see trends towards ‘metricisation’ – quantifying, analysing, and comparing students, programmes, or institutions by partial, pre-defined measures (Williamson, Bayne and Shay, 2020). It also highlights potential issues where systems or pedagogies that are difficult to model may be restructured or replaced to accommodate existing measures and metrics. Complementary to this is the possibility of decisions around digital data capture and measurement being made by software engineers rather than educators (Selwyn and Gašević, 2020). It was an interesting thought, and perhaps one that surfaced through my next blog, Seeing Data.
Seeing data in education
I examined an aspect of student datafication through the Blackboard Learn Course Dashboard. The analytics shared a common theme – time. Time was variously presented as an independent variable against which student grades were compared (figure 2a). These visualisations forwarded a correlative if not causative connection between time and grades (Jarke and Macgilchrist, 2021), which I feel could be harmful to students and educators if they are led to view this as an accurate measure of a situation, instead of the narrow abstraction that it is (Carter and Egliston, 2023). I highlighted some flaws, notably inaccuracies rising from measuring a subset of a single aspect (time in LMS) against success; forwarding a single narrative or interpretation of data can minimise or eliminate important contexts (Hartong and Förschler, 2019).
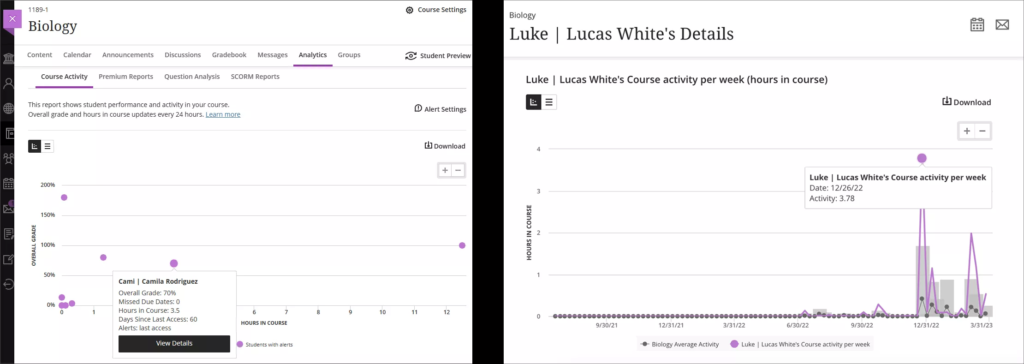
Figure 2a: Two visualisations comparing student marks against time
Furthermore, as a facet of the hidden curriculum within digital education, standardised LMS systems and visualisations without appropriate consideration or context could impact the experience or perception of neurodivergent students, those with accommodations, specific personal/economic/geographic circumstances, resulting in a reproduction of existing inequalities (Gallagher, Breines and Blaney, 2021).
However, through my efforts to create an alternative visualisation (figure 2b), I understood the difficulty producing a data visualisation that was both useful and viable from a data collection perspective. I suspect the simplicity of collecting time as a data point within a system that likely already measures engagement is a compelling option for platform developers.
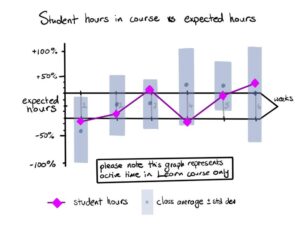
Figure 2b: Student hours in course vs expected hours as % deviation
My visualisation in comparison would put additional data input burden on educators which could be viewed as excessive, going beyond what is necessary to provide the service (education), and more complex than line or scatter graphs, (dis)advantaging those with varied data skillsets. Through the lens of Pangrazio’s overarching ‘data harms’ (2024), my solution could also fall short; alienating through monitoring (time in course), erosion of digital privacy (excessive data collection), increased labour on educators, and possibly reinforcing a bias that time is an indicative metric. LMS dashboards are an evolving solution that require consideration of and input from all stakeholders to provide fair systems that track progress and provide meaningful insights.
Using data in education
After considering the complexities of construction I moved on to Using Data. I considered a broader perspective on data not just from the point of view of a data subject, but the choices and responsibilities of institutions as data controllers and processors. I proposed a data system that built upon Blackboard Learn: Learning Outcome Mapping. In the visualisation (figure 3) we see the complex interconnections between actors and data flowing through systems. I envisaged breaking open the ‘black box’ of analytics to create a transparent tool that is useful to both staff and students (Tsai, Perrotta and Gašević, 2020).
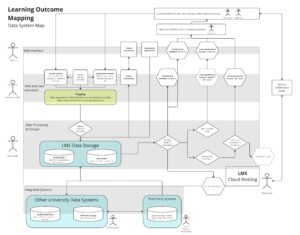
Figure 3: Learning Outcome Mapping – Data System Map
Returning briefly to Pangrazio’s ‘data harms’, we immediately see a balance to be struck; to extract more data, it must be generated somewhere. To feed the machine, increased data surveillance (alienation) and/or increased data input (labour) is required. I chose a system that would require additional data production by educators, as I felt the output had compelling potential to directly benefit their teaching.
Such data monitoring can further influence power dynamics, such as creating ‘centres of calculation’ whereby a central authority makes decisions based on aggregated data that is partially or wholly invisible to other actors within a system (Hartong and Förschler, 2019). There are also frictions caused between stakeholders requiring data to be simultaneously simple and accurate, which is difficult to rationalise against Kühne’s mapping, reduction, and pragmatics (2005). These speak to potential tensions within educational institutions where actors at differing levels of decision-making have varied uses for (or perspectives on) the same data.
Governing data in education
Finally, I ventured into the complex contractual language used in Governing Data. As higher education tracks the broader trend towards a digital economy, it is important to understand the governance underpinning the increasing platformisation of the sector (Komljenovic, 2022).
My case study, Miro (figure 4), showed that user service ‘agreements’ were made up of multiple, inter-referenced documents that were challenging to decipher. These agreements give platforms the ability to extract value from voluminous aggregate data to inform, market, and innovate (Komljenovic, Birch and Sellar, 2024). I see less certainty in the ways institutions can extract value from user data, particularly if access to said value is contingent on both monetary and data rents to platforms.
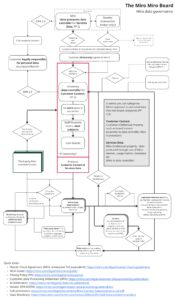
Figure 4: Miro governance visualisation
If Miro is indicative of the norm, platforms – and therefore the associated data systems and actors – are stratified networks of further interconnected platform services. It brings another meaning to the phrase ‘platform ecosystem’ – not just describing the internal-market workings of a single platform (such as Udemy or Facebook), but also the complex dependencies and inter-reliance platforms and data systems invoke in the delivery of their end-user services. Such structuring is likely a factor in a platform’s ability to scale, but it also makes data governance arrangements more elaborate and opaque.
Conclusion
I have an appreciation for the complexities that educational institutions face in navigating their responsibilities both as a data controller for staff and students, and as a platform customer. Students, staff, and institutions can be empowered to make decisions and reflections through interrogation of data. However, there are overlapping issues to remain mindful of, including:
- Gaming of datified systems – Reflecting wider moves towards metricisation such as rankings, institutions could be motivated to tailor strategies to target indicators of performance rather than causes (Hartong and Förschler, 2019; Williamson, Bayne and Shay, 2020)
- ‘Greedy’ data systems – Potential data harms to users through excessive data collection and retention in a push to quantify and analyse everything (Brown, 2020)
- Fallacy of objectivity – Data is partial, and a fractional model of complex and nuanced systems, but can be highly persuasive when presented as objective fact (Williamson, 2017; Mikhaylova and Pettersson, 2024)
- Hidden curriculum – Standardised data systems designed by and for a ‘model global north’ may replicate existing (or possibly introduce new) biases (Gallagher, Breines and Blaney, 2021)
- Closure of pedagogies – Potentially minimising or re-moulding pedagogies that are difficult to datify to fit existing systems (Williamson, Bayne and Shay, 2020)
- Complex governance – Education data governance frameworks should forward the interests of users and national policy over commercial interests (Hillman, 2023)
Data has potential to inform, but also to harm. For stakeholders to have confidence in its use, data must be transparent and purposeful, from governance down to end-users. Institutions should balance maximising its value with minimal negative impact.
References
Brown, M. (2020) ‘Seeing students at scale: how faculty in large lecture courses act upon learning analytics dashboard data’, Teaching in Higher Education, 25(4), pp. 384–400. Available at: https://doi.org/10.1080/13562517.2019.1698540.
Carter, M. and Egliston, B. (2023) ‘What are the risks of Virtual Reality data? Learning Analytics, Algorithmic Bias and a Fantasy of Perfect Data’, New Media & Society, 25(3), pp. 485–504. Available at: https://doi.org/10.1177/14614448211012794.
Gallagher, M., Breines, M. and Blaney, M. (2021) ‘Ontological Transparency, (In)visibility, and Hidden Curricula: Critical Pedagogy Amidst Contentious Edtech’, Postdigital Science and Education, 3(2), pp. 425–443. Available at: https://doi.org/10.1007/s42438-020-00198-1.
Hartong, S. and Förschler, A. (2019) ‘Opening the black box of data-based school monitoring: Data infrastructures, flows and practices in state education agencies’, Big Data & Society, 6(1). Available at: https://doi.org/10.1177/2053951719853311.
Hillman, V. (2023) ‘Bringing in the technological, ethical, educational and social-structural for a new education data governance’, Learning, Media and Technology, 48(1), pp. 122–137. Available at: https://doi.org/10.1080/17439884.2022.2052313.
Jarke, J. and Macgilchrist, F. (2021) ‘Dashboard stories: How narratives told by predictive analytics reconfigure roles, risk and sociality in education’, Big Data & Society, 8(1), p. 20539517211025561. Available at: https://doi.org/10.1177/20539517211025561.
Komljenovic, J. (2022) ‘The future of value in digitalised higher education: why data privacy should not be our biggest concern’, Higher Education, 83(1), pp. 119–135. Available at: https://doi.org/10.1007/s10734-020-00639-7.
Komljenovic, J., Birch, K. and Sellar, S. (2024) ‘Monetising Digital Data in Higher Education: Analysing the Strategies and Struggles of EdTech Startups’, Postdigital Science and Education, 6(4), pp. 1196–1215. Available at: https://doi.org/10.1007/s42438-024-00505-0.
Kühne, T. (2005) ‘What is a Model?’, in J. Bezivin and R. Heckel (eds) Language Engineering for Model-Driven Software Development. Dagstuhl, Germany: Schloss Dagstuhl – Leibniz-Zentrum für Informatik (Dagstuhl Seminar Proceedings (DagSemProc)), pp. 1–10. Available at: https://doi.org/10.4230/DagSemProc.04101.15.
Mikhaylova, T. and Pettersson, D. (2024) ‘The timeless beauty of data: inventing educational pasts, presents and futures through data visualisation’, Critical Studies in Education, pp. 1–17. Available at: https://doi.org/10.1080/17508487.2024.2308689.
Pangrazio, L. (2024) ‘Data Harms: The Evidence Against Education Data’, Postdigital Science and Education, 6(4), pp. 1049–1054. Available at: https://doi.org/10.1007/s42438-024-00468-2.
Selwyn, N. and Gašević, D. (2020) ‘The datafication of higher education: discussing the promises and problems’, Teaching in Higher Education, 25(4), pp. 527–540. Available at: https://doi.org/10.1080/13562517.2019.1689388.
Tsai, Y.-S., Perrotta, C. and Gašević, D. (2020) ‘Empowering learners with personalised learning approaches? Agency, equity and transparency in the context of learning analytics’, Assessment & Evaluation in Higher Education, 45(4), pp. 554–567. Available at: https://doi.org/10.1080/02602938.2019.1676396.
Williamson, B. (2017) Big data in education: the digital future of learning, policy and practice. SAGE PUBLICATIONS. Available at: https://www.vlebooks.com/Product/Index/965054.
Williamson, B. (2019) ‘Policy networks, performance metrics and platform markets: Charting the expanding data infrastructure of higher education’, British Journal of Educational Technology, 50(6), pp. 2794–2809. Available at: https://doi.org/10.1111/bjet.12849.
Williamson, B., Bayne, S. and Shay, S. (2020) ‘The datafication of teaching in Higher Education: critical issues and perspectives’, Teaching in Higher Education, 25(4), pp. 351–365. Available at: https://doi.org/10.1080/13562517.2020.1748811.
(https://pixabay.com/illustrations/paper-patterns-pattern-texture-213695/)
(https://help.blackboard.com/Learn/Instructor/Ultra/Performance/Course_Reports/Course_Activity_Related_to_Grades; https://help.blackboard.com/Learn/Instructor/Ultra/Performance/Course_Reports/Course_Activity_Related_to_Grades/View_Individual_Student_Course_Activity_Data)


Leave a Reply
You must be logged in to post a comment.