

You’ve just been appointed Head of School. A major research funder for your department has just reported major losses to income. Another has shifted their funding priorities and eligibility criteria. You have colleagues who have been applying to the same funder for years. How can you safeguard long term stability of research in your department?
It is easy to see how the practice of setting individual research income grant targets has arisen.
However, we know that setting grant and other single metrics based targets for individuals are not effective.
Can we use the data we hold in a better way to support researchers and research?
In this blog, we set out new ways that we could develop and use research funding data in the University and how this can be used ethically in aggregate to support research.
Setting the Scene
The University of Edinburgh typically receives around £300M per year in research grant income. This is the level of grant income required, alongside supporting block funds from the UK Government and University income from other sources, e.g. teaching activity, to sustain the current research staff base and facilities.
We have been working to develop our research funding business intelligence offering at the University, by bringing together an experimental dataset of research application activity with some basic HR information from our new Enterprise Data Warehouse. We want to understand how to recognise all Edinburgh investigator contributions (both Principal Investigator and Co-Investigator) and to understand more clearly research grant application patterns and trends by career stage.
Because these data have never been used for this purpose before, and are drawn from new systems currently being commissioned, we have undertaken a full Data Protection Impact Assessment and implemented a rounding and suppression strategy for anonymization of statistics, broadly following the HESA methodology.
We are discussing examples of these data now on a limited basis in this blog to:
- to highlight what could be done in the future to make better use of statistics and data that the University holds across many systems.
- to aid development of cross-University Data Warehouse based projects.
- to build data quality in the underlying systems.
This dataset has been developed as a proof of concept and for the time being, readers should be suitably cautious in interpretation.
Myth #1: Most senior researchers (e.g. Professors) at research-intensive Universities normally bring in at least a few hundred thousand pounds of research income each year each.
This is not true.
As an example, let’s look at a small and anonymous part of Edinburgh’s College of Medicine and Veterinary Medicine, in 2020. Medicine based subjects are more expensive (e.g. lab costs, clinical trials). By necessity there is a higher level of grant application activity. If this statement is true anywhere, we’d expect to see it in parts of Medicine.
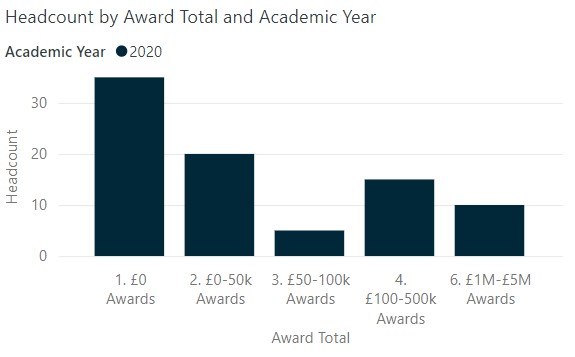
This figure shows the number of University of Edinburgh Salary Grade 10 (or medicine scale equivalent), by research grant award total band accredited to the investigator in an anonymous section of the College of Medicine and Veterinary Medicine.
In 2020, the most common outcome in this area was no new research awards for senior staff (around 40%). We can then see the remainder have a wide range of award totals, with around 10 (~10%) being awarded grants with a total in range of £1-5M. Individuals with award totals in the range of £50k-100k were relatively uncommon. Around a third of award total in the year looked at was awarded to just three investigators in this area.
Does this mean we have a large number of senior staff who are unsuccessful/not applying in this area?
No. Remember a typical research grant lasts three years or more. In this area of the University in the year looked at, 80% of staff above were applying for grants in the same year, and most were involved with live ongoing grants. With varying capacity of senior investigators year to year, varying costs of research programmes (e.g. clinical trials), many more good applicants than grant monies available, and generally fewer ‘large slices’ of grant monies available to win, this ‘long tailed’ distribution is a normal pattern to expect.
So why have there been instances of setting specific grant targets/annum in the UK University sector?
Some institutions have chosen to set targets in the past derived from Higher Education Statistics Agency (HESA) research income benchmarking. This is typically by dividing research income by researcher headcount split by subject areas to give a typical amount per researcher per year.
HESA research income is useful to use in aggregate at a School/Department level to compare with others in the sector. It can guide you on whether the research income you have overall is comparable with other similarly sized departments at other UK Universities.
However, it is not useful at the individual level because it cannot show the underlying distribution of individual grants won by a typical researcher. The Mean, Median and Mode are very different! For example, research income in research intensive Universities often includes very large recurring grants, one-off equipment grants etc. This is especially the case for the larger Universities hosting major institutes or facilities. These are typically not competitive funding tied to individual researchers, but funding for these can significantly inflate any research income/head calculation.
Myth #2: Previously unsuccessful researchers do not win big award totals. Success rates for high value awards are too low to try.
Very much not true, on both counts!
In fact, failure along the way is normal for the most successful grant winners.
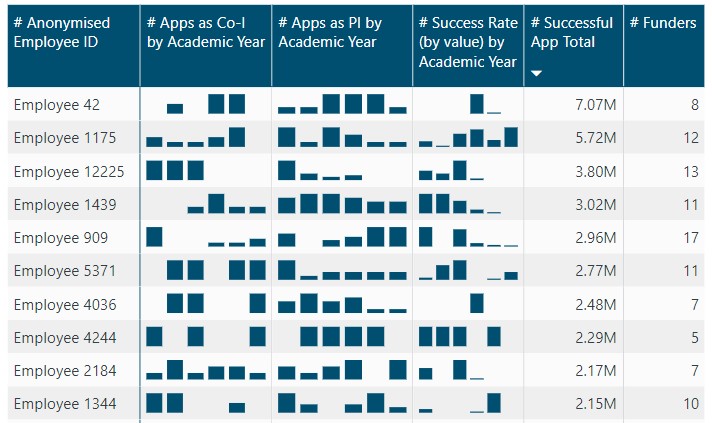
This figure shows the application patterns of the top 10 researchers by total grant income won (anonymised) in the last six years in a School in our College of Science and Engineering. We can see that:
- In almost all cases they are applying for research grants every year.
- They are applying as Principal Investigator, and also as Co-Investigator on other investigators’ applications.
- All are applying to a diverse range of funders over the six year period.
- Success rates across the six years are very variable – success is not a given in any one year, even for the historically most successful research award winners.
Research grant application trends and funders applied to are very context specific. What the norms are will be very different across subject areas. This figure is intended to be used as an illustrative example only, to bust a myth!
Responsible Uses of Research Grant Metrics
Working within the current UK research funding system, the goal is to have enough applications that are successful to support a healthy research base.
Any one individual researcher’s success or lack of success should not impact on a School/Department as a whole.
What could cause a problem in relation to research funding?
- Large scale decline in research applications across specific cohorts – e.g. a career stage, protected characteristic or specific institute/subject area.
- High rate of unsuccessful applications in some areas and subsequent impact on morale and potential reputational damage with funders.
- Concentration of successful research application activity in just a few individuals.
- Too much reliance on too few funders.
- Target setting of e.g. specific grant amounts for which an individual has no control over the outcome and subsequent reputational risk to the University/risk to future funding (many funders look for commitments to responsible use of metrics as a condition of grant).
- Differences in application activity between different protected characteristics, suggestive of equality impacts in the current system.
To assess and mitigate these risks, starting to explore analysing the data we hold on research applications in aggregate gives us more reliable intelligence than individual data points do. As the University grows in internal data and business intelligence maturity, we will hopefully be able to do more – watch this space!
Acknowledgements: A big thank-you to the colleagues who have delivered the new Enterprise Data Warehouse HR Strategic Reporting Datamart to the University and supported our existing datasets over the last year. This includes the Strategic Planning team, ISG Business Intelligence Team, ISG Research Information Systems Team, Institute for Academic Development, colleagues in the College Offices and Edinburgh Research Office.
About this author
This post was written by Dr Louise Ker in her role as Strategic Research Executive (Analytics), in Edinburgh Research Office.