An important part of our brief asked us to consider the ways in which we might step beyond the digital platform and encourage a wider community involvement with the collections. Ultimately, our work would explore ways of raising the profile of the collections and encourage their use in exhibition, teaching and research.
We are therefore keen to treat the digital platform as just one part of the exhibition, with a variety of outreach activities taking a prominent place alongside the digital exhibits. Unsurprisingly, we couldn’t help but be very ambitious – with activities ranging from satellite “wellbeing pods” displaying artwork and promoting mindfulness, through to scheduled programming like self-guided walks, art workshops, and even puppy therapy sessions.
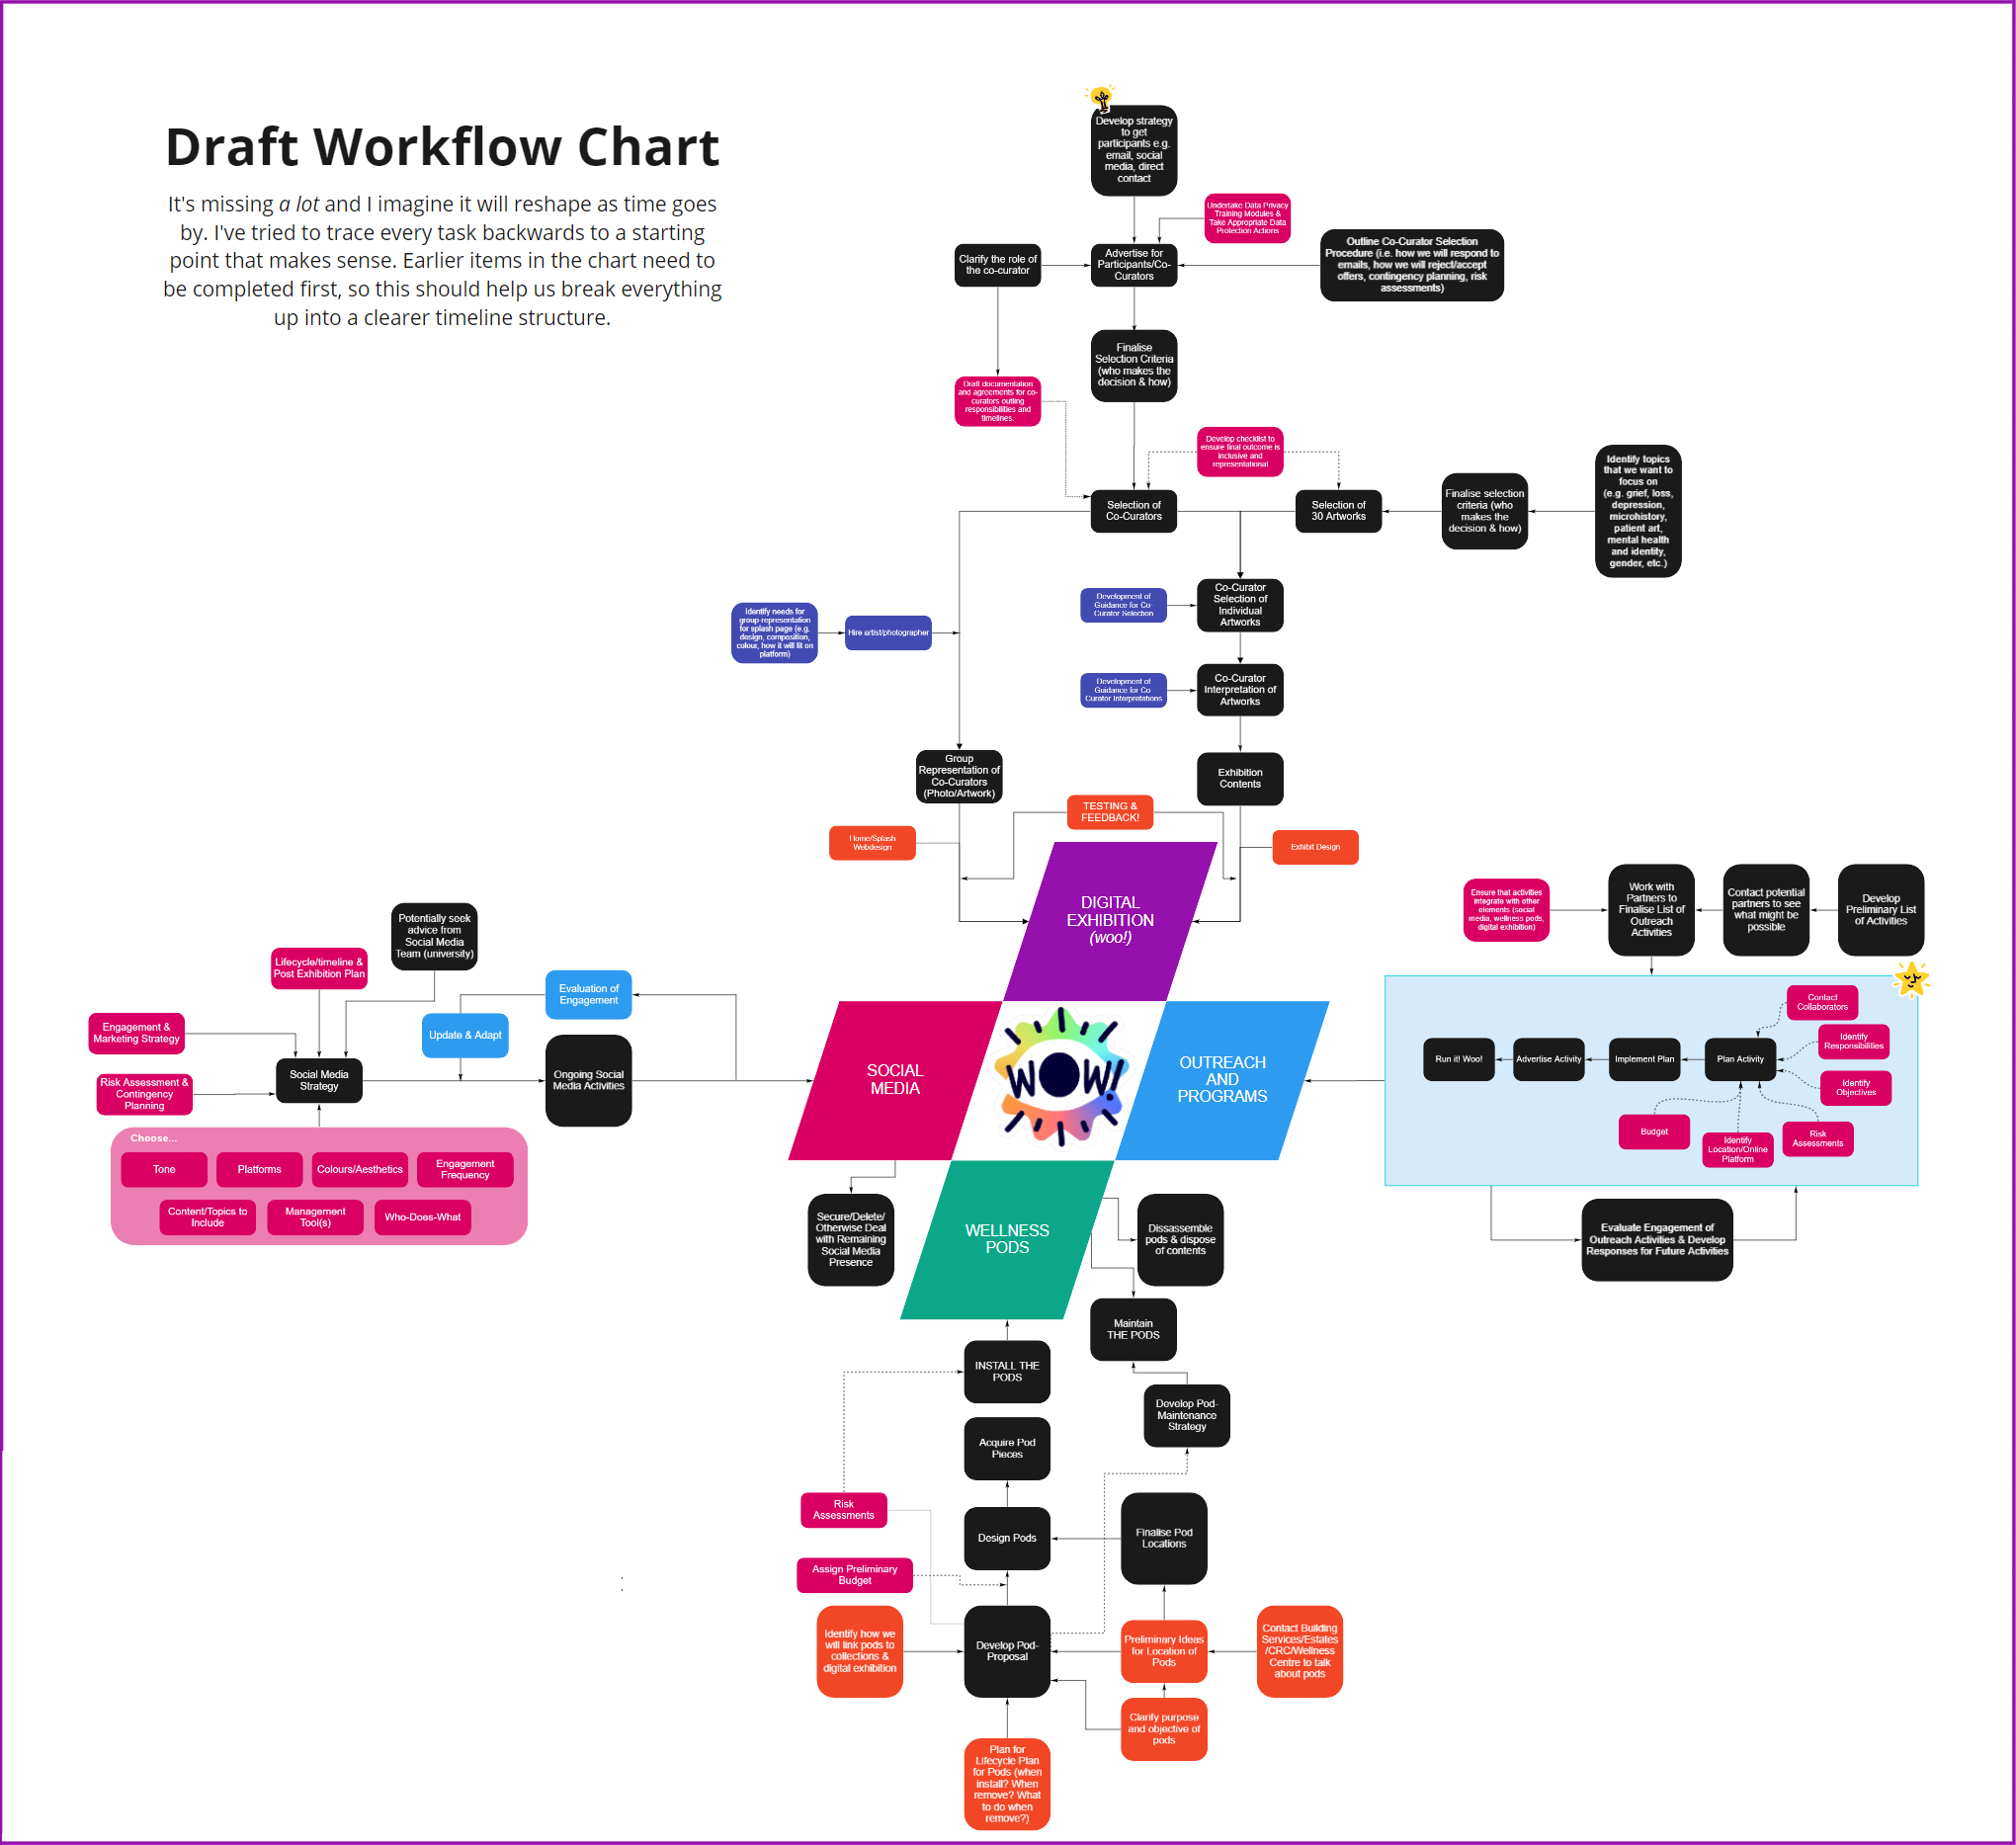
An early draft of a priority/dependency chart. As the project progresses, we follow the arrows inwards from the outermost tasks. Click to enlarge.
We soon narrowed these ideas down (sadly dropping the puppy therapy), and broke them into three branches: the digital exhibition, outreach programming, and the wellbeing pods. But we have become aware that even if we reduce the quantity of the individual initiatives, when combined with all of the other factors (such as social media, exhibition work, and co-curatorial practices which we are keen to engage with) the project could rapidly become unfeasible.
We have therefore started to think about project management strategies, utilising tools like Gantt Charts (as advised by members of the CRC), flow diagrams, and online workspaces in which to share our progress. We decided to split the management of the project into five areas: exhibition development, outreach & programming, social media, the wellbeing pods, and logistics. We recognise that we will likely have to frequently revisit our strategy to ensure it parallels our actual working plans, and we hope this approach will help to split the workload while also keeping us on track.
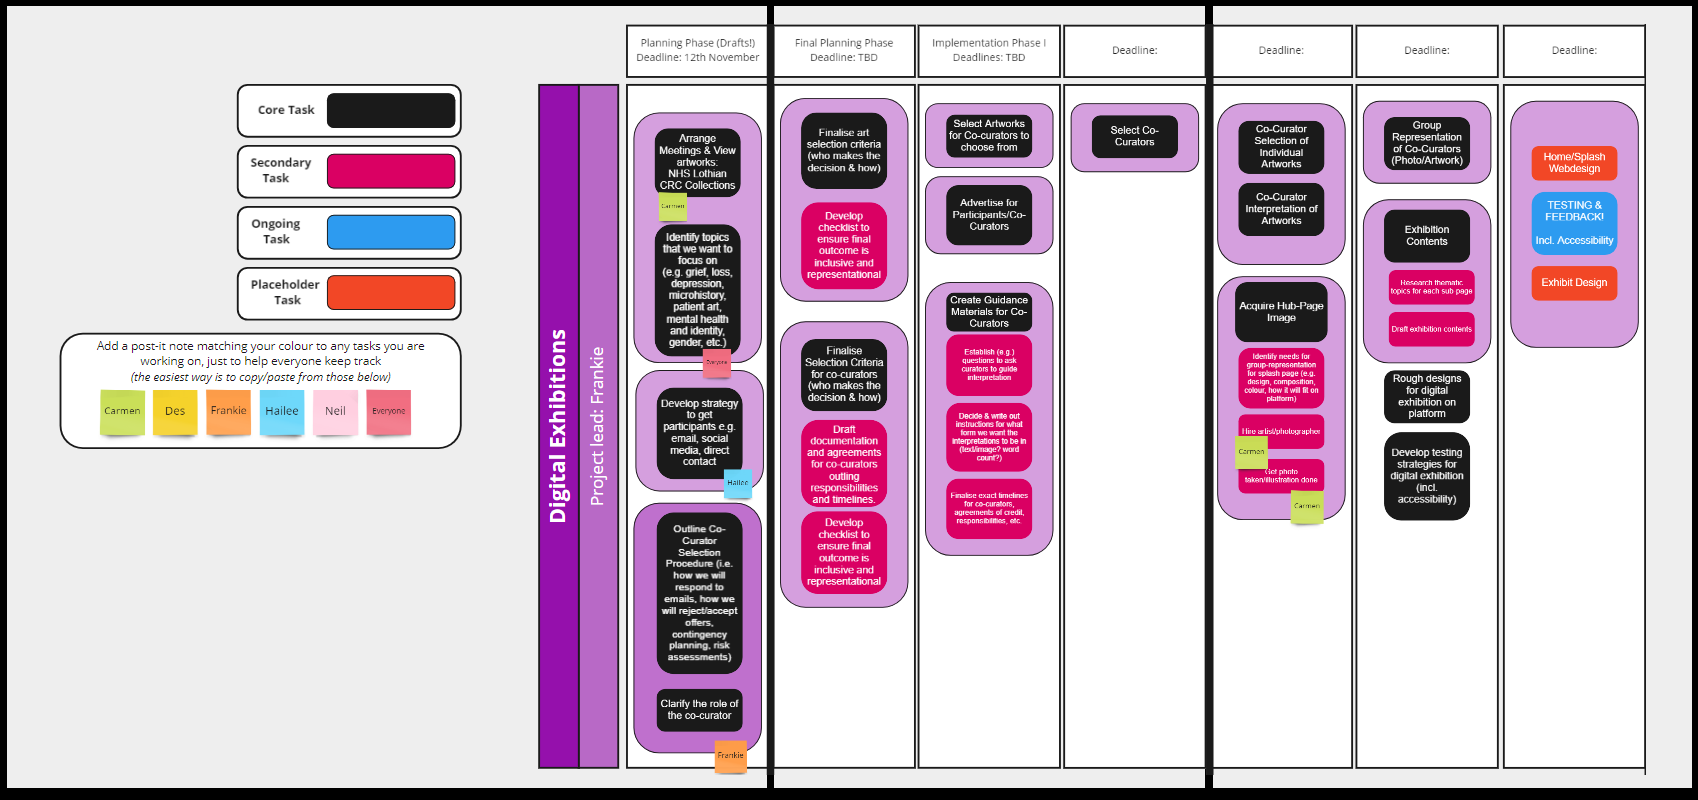
A first draft of a timeline for the “Exhibition Development” strand which Frankie is managing. Each column represents tasks needing to be completed before moving to the next column. Team members indicate that they are working on a task with virtual post-it notes. Click to enlarge.

Leave a Reply