PhD ramblings: Sep ’23 – Feb ’24
PhD ramblings
Part one: Sep ’21 – Feb ’24

Amplitude spectrum for seismic station KARA – dead (right) or alive (left)
Cool people leave school at 27 years’ old
“131! Kara! Kara?! 131?!” is my soundtrack as I begin writing this reflection on the first five months of my PhD. Kara ordered a flat white from a café in London Stansted Airport and has forgotten about it, or maybe had to rush off with gritted teeth to catch a flight. It reminds me of the seismic station KARA, which had a signal drop-out towards the end of 2022 following a strange period of anomalously-loud low frequencies on its vertical component, and, for whatever reason, stopped listening to the world around it. The amplitude spectrum became that of random electrical noise – often described as “flat”, or “white”.
In 2018, I left Bolton (side note: Bolton never left me) to do a degree in geophysics at the University of Edinburgh. I returned south of the border to do a master’s degree in exploration geophysics in Leeds, but became smitten with someone up in Edinburgh and needed an excuse to move back… so I applied for a PhD, a potentially round-a-bout and over-complicated way of “getting the girl”.
There are, of course, other reasons I’m doing this. Seismology has been a huge interest of mine since I was 16 – a romantic geology-enthusiast living in the moorlands with hardly a rock outcrop to satisfy his new obsession, and needing a means to see below the surface. My A-level geology teacher pointed me towards books in the college library, where I found the classic textbook “An Introduction to Geophysical Exploration” and learned about exploration seismology. The first seismic reflection image I saw was from the MOIST (Moine and Outer Isles Thrusts) traverse completed by BIRPS (the British Institutions Reflection Profiling Syndicate) in 1981. Oh man… I drooled over that image for a couple of hours every day for about two weeks, looking for every detail I could find – I was completely hooked.
This passion started to achingly ebb away as the degree years rolled on, picking up again in Leeds, but then butchered during a short stint at BP. For the first time, I saw seismology being used often brutishly and somewhat pessimistically, where the joy was not in the science but in the cash it can generate. Whilst marvelling at a wondrous collection of rock core, full of colours and shapes and history, I was interrupted by my boss – “can you smell the money?”, he asked me non-ironically. It smells like shit. Despite the sponsorships and the prizes, the idea of hanging around this stink made me realise – I need to rediscover my love for seismology.
I interviewed for the E4 doctoral training programme in Edinburgh, using the plastic cups in the interview room as seismic arrays to illustrate my points. In a cripplingly nerve-wrecking day, my partner and I both got the call. I finished at BP on Friday, and started my PhD the following Monday.
SALSA – from sauce to source
SALSA (Southern Alps Long Skinny Array) is a seismic array deployed in 2021 by a team from the Victoria University of Wellington (VUW) along the Alpine Fault in New Zealand. This is a classic conservative plate boundary, visible from space, where the Pacific and Australian plates grind past each other in a jerky stick-slip fashion, producing earthquakes of typical magnitude M8 roughly every 300 years. When was the last one? 1717. Crikey! The objective of the SALSA project is to predict what might happen when the “Big One” goes off.
45 broadband seismometers were placed at roughly 10km intervals along the length of the Alpine Fault. For two years they listened to the ambient noise of the earth – deep rumblings produced by the powerful and violent oceans around the South Island. What use is listening to noise? My music teacher once asked me if I thought it was just a coincidence that the words “musician” and “magician” were so similar – if “seismologist” was anything close to “magician”, I would now ask the same question. INTERFEROMETRY (22 Scrabble points): given two recordings of ambient noise by two receivers and a small bucket full of assumptions, you can estimate the signal on one had the other been a seismic source, i.e. the inter-receiver Green’s function. Noise is turned into signal, without ever needing a controlled source!
The SALSA project aims to find the Green’s functions from anywhere along the fault to anywhere in the South Island; when given an earthquake source model, these can then be used to estimate the ground motion during an earthquake. But you need to know where the earthquake might occur. A seismic velocity model of the subsurface will help search for asperities (sticky or sticky-outy bits on the fault that build up stress), and help locate seismicity. My part in this work will be to use interferometric retrievals to build a velocity model of the crust around the Alpine Fault.
It’s hard to take life seriously when you’re surrounded by acronyms
The beginning of my PhD involved downloading this data to Edinburgh’s local servers. The SALSA data is kept at the IRIS (Incorporated Research Institutions for Seismology) DMC (data management centre), where you can use a software developed by PASSCAL (Portable Array Seismic Studies of the Continental Lithosphere) called BREQFAST (Batch Requests – Fast… that one’s a bit crap but quite amusing) to download your data. It was a crash course in command line operations and shell scripting – actually not too bad! I spent about a month organising files and making “breakfast”-related puns, before I got an unexpected email.
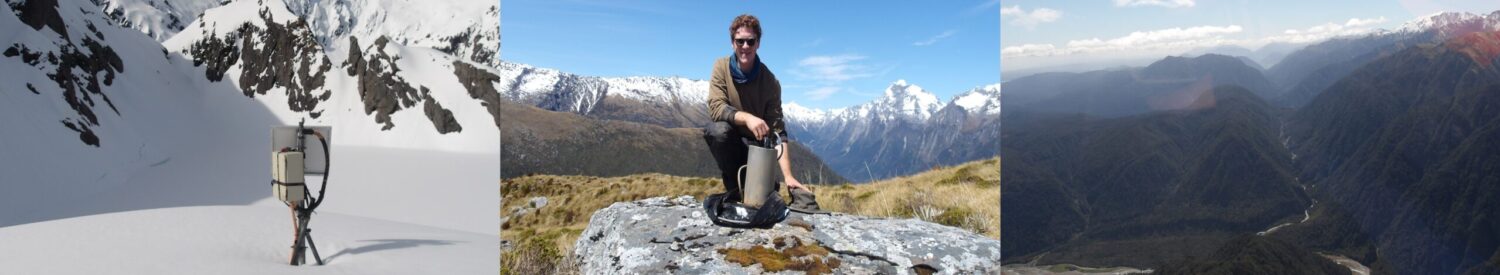
Can you be in New Zealand for field work in 6 days’ time? It was time for VUW to pull SALSA out the ground – “Hey SALSA, heard anything new?”. Now, you see… I’ve not travelled long-distance before, and the only bit of land further away than this is the Moon. I booked my flights in a pub at midnight, bought two weeks’ worth of field gear (all mine was back in Bolton – I was planning to bring it up later), wrote a long risk assessment and organised travel insurance and visas in three days. Then I was off on a non-stop journey by train from Edinburgh to London, plane from London to Houston to Auckland to Wellington, by taxi to VUW, where I caught a ferry to the South Island, and travelled by car over to the West Coast. The first two weeks were spent driving and flying from station to station, in the green corridor between the dramatic Southern Alps and the raging Tasman Sea, following the Alpine Fault like a highway to the end of the world. It was an utterly new experience, giving me an invaluable understanding and feel for the instruments and the island (read more about it here: https://blogs.ed.ac.uk/jackandrewsmith/tag/new-zealand-2023/).
The next two weeks were spent at VUW converting the raw data we had picked up from the instruments into usable files called miniSEED files, using more software developed by PASSCAL, before the GSNZ (Geoscience Society of New Zealand) conference. I sat in sessions on landslides, volcanology, seismology, and social science – learning about all the moving parts in the path of knowledge, particularly enjoying discussions about data. It was the theme of the trip – what role does data play in scientific research? How should it be handled for use by researchers around the world? Does data actually represent a ground truth? Are purely data-driven inversion methods such as naïve machine learning conforming with the scientific method?
What happened to Kara’s flat white?
Speaking of data, it was time to actually start doing my job and get to know the squiggles. Modern seismometers use an electrical feedback system to keep a mass centred whilst the rest of the box moves around it, providing a voltage proportional to ground velocity. Random electromagnetic noise and voltage spikes can cause electronic systems to misbehave and become even more unfaithful to the real ground motion, screwing up your results. This data needs to be weeded out before you can play with it with any confidence.
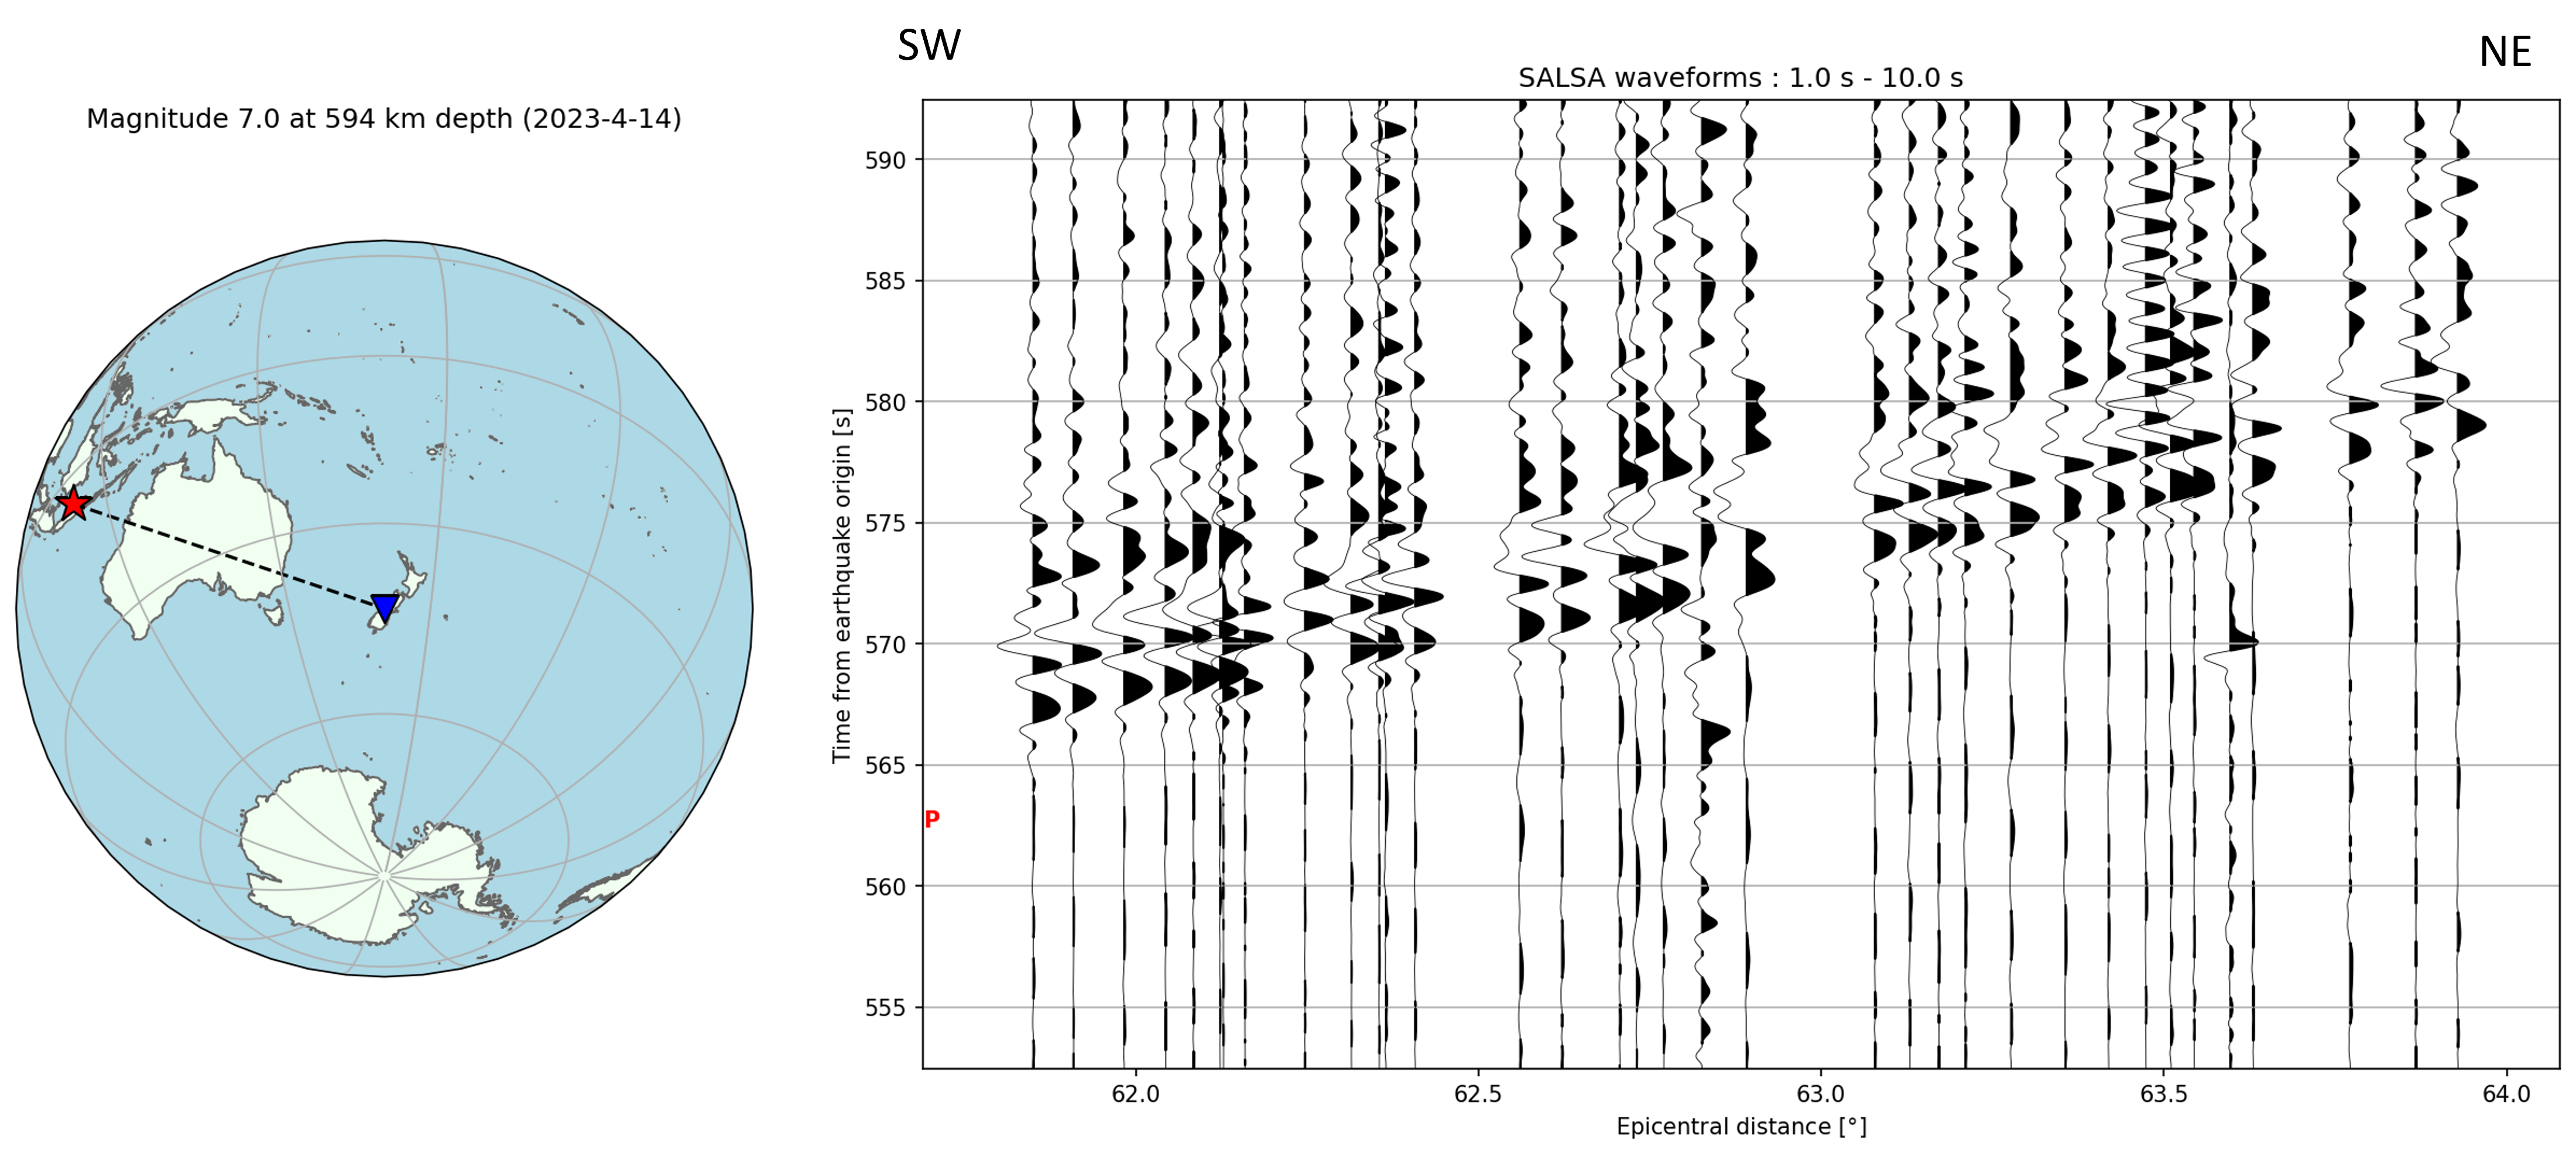
The data that we start off with is in the time domain – it is a series of measured amplitudes in time representing the voltage required by the electronic feedback system to counter the mass movement. This can be transformed into ground velocity if the voltage response to ground movement is known – removing the so-called instrument response to ground motion. It isn’t immediately obvious if there is anything wrong with the wiggles you see when just looking at ambient noise, as it tends to look very similar to random noise. The first thing I did to check the waveforms in the time domain was look at distant (teleseismic) earthquakes arriving across the array. Because the earthquakes are far away, the seismic body waves will travel through the earth and hit the array from below, arriving at all stations at the same time. If there is a delay in the travel time to any of the stations, or a distinct difference in the character of the waveform, then this station may have an error. But there aren’t earthquakes all the time – this is not the best method to quality-check 90 years’ worth of squiggles sampled 100 times a second.
A time series can be decomposed into it’s constituent frequencies – transformed into the frequency domain. Ambient noise will tend to have a particular amplitude spectrum in the frequency domain, and there are three features that should be common to most spectra that I look out for. At around 5-10s period, there is usually a peak called the secondary microseism. This is due to the interaction of ocean waves with similar frequencies travelling in opposite directions. There is also sometimes a peak, or at least a consistant signal as seems to be the case with SALSA, at around 10-20s period called the primary microseism. This arises due to the direct interaction of ocean waves hitting the crust, which produces noise with the same period as the ocean waves. There is also often a long period signal associated with the oscillation of Earth’s normal modes known as “Earth hum”. By transforming the time series to the frequency domain, large amounts of data can be viewed at the same time and in a simplified form. This can be done by turning the entire time series into an amplitude spectrum, or split the time series into chunks and analyse how the frequency components change over time – a spectrogram. I compress the time series to sound files in the audible frequency range for humans, as the ear produces a natural spectrogram (musical notes are different frequencies that your brain is able to separate) and can pick up patterns that the eye might not see. The first time I did this, I stretched the frequency range to be over the entire human hearing range from 20Hz to 20kHz – all the possible audible frequencies played at the same time and I got a headache in about half a second. A military-grade sonic weapon, I swear.
When viewing time series, three features jump out at me. The first are regular pulses known as calibration pulses, where the instrument is testing its response to an impulse – pinching itself to make sure it’s awake. The second are sudden decreases in amplitude variations by about half, and a jump in mean amplitude. This occurs as many seismometers use a double-ended output to measure voltage. Whereas a single-ended output compares the signal voltage to an electrical ground, a double-ended output compares the signal voltage to an inverted version of itself. The two outputs will have opposite signals, but electromagnetic noise will be common between them and get cancelled out, so the measurements will be more robust against internally- and externally-generated electromagnetic noise. If one of these outputs fails, however, it doesn’t work… obviously. The third is a signal blackout. For whatever reason, your seismometer stops any output and all you record is electrical noise convolved with the instrument response. This is visible in the frequency domain as a flat spectrum with low amplitude.
A couple of things are only really identifiable using the amplitude spectra and audio recordings. The first is the instrument getting stuck in the short-period mode. The length of time it takes to adjust an instrument (e.g. center the mass) is equal to the low frequency corner of the instrument response, which can be on the order of 100s. Therefore, to save time the instrument can be set to a short-period configuration, reducing the 100s period to 1s. If this gets stuck there however, any frequencies below 1Hz will not be faithfully recorded, and a sudden decrease in the amplitude spectrum below 1Hz is clearly visible. Secondly, the instrument can get stuck in the Galperin-mode configuration. Broadband seismographs have three seismometers to measure three components – northwards, eastwards, and vertical movement. Instead of the three seismometers being orthogonal to each other, measuring the three components directly, they all record a component of horizontal and vertical movement in order for manufacturers to focus on one type of suspension, and are then separated out using a mixer. If there is a sudden jump in voltage for whatever reason, the mixer can fail. As the vertical component is less sensitive to long period ground tilt than the horizontal components, if the mixer fails then the vertical component will appear to record anomalously loud low frequencies (as it gets mixed with horizontal movement). This is identifiable on the amplitude spectra and heard as a sudden deep rumble on an audio recording, and can be fixable if the mixer formula is known! This is what happened to KARA, before she disappeared off the radar and left us to look after a lonely flat white. It’s poetry.