Understanding large-scale changes to landscapes requires monitoring at national to global scales. Satellites are being increasingly employed for this as they are the only way to make regular, global scale measurements and, uniquely, monitor every point of the Earth in a consistent manner. Over the last few decades, satellites have provided the data needed to gain insights into rates of deforestation, the impact of drought and temperature extremes on rainforests, the frequency and severity of wildfires, cloud distributions and polar ice extents, amongst many others. Satellites are becoming an essential tool for monitoring landscapes and natural resources.
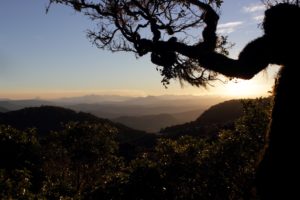
The forest of Lamington National Park, Queensland Australia
A wide range of sensors are mounted on satellites for Earth observation (EO). Passive optical sensors, the most common, function much like digital cameras (although often extending beyond visible light into the infra-red), taking images of sunlight reflected from the Earth’s surface. These are routinely used to measure the “greenness” of the land surface, although infra-red is used, as plants appear much brighter in infrared than they are in visible light. This measure of “greenness” can be used determine the land cover type of a given area (eg. forest, grassland, urban) and monitor the growth, senescence or clearing of vegetation over time.
The satellite observation period began properly with the USA’s Landsat program, launched in 1972 by NASA and regularly updated with new satellites. Landsats 7 and 8 are currently in orbit, launched in 1999 and 2013 respectively whilst Landsat 5 currently holds the record for the longest Earth observation mission, lasting from 1984 to 2013. The Landsat satellites use passive optical instruments to image the Earth. For many years this data was treated as a commercial product, with users needing to buy each image. This somewhat limited the uptake of Landsat data and freely available (although coarser spatial resolution) datasets from other sensors, such as AVHRR and MODIS, were more widely used. The US took the decision to open up the archive in 2008, leading to an explosion in the use of Landsat data. One particular example of using Landsat for landscape monitoring is the Global Forest Watch product (https://www.globalforestwatch.org), generated by Matthew Hansen of the University of Maryland in one of the first uses of the Google Earth Engine. A global, high-resolution (30m) estimate of the presence or absence of forest cover, and an estimate of which areas have been deforested in a given year, has been generated and is regularly updated. This product is being widely used to monitor deforestation around the world.
Since the launch of Landsat, there has been an ever increasing number and variety of satellites monitoring the Earth. At the end of the 20th century, NASA started work on the Earth Observation System (EOS), launching a fleet of satellites to measure nearly every aspect of the Earth, including passive optical sensors to monitor vegetation, lasers to measure the ice caps and clouds, microwave detectors to map sea ice and snow, ultra-violet cameras to monitor radiation from the sun and a unique instrument sensitive to variations in the strength of gravity around the world in order to monitor the hydrological cycle. For many years NASA has had an open data policy, so that anyone can download the data from these satellites and perform their own studies (https://earthdata.nasa.gov). This has made them incredibly popular within the landscape monitoring community.
Around the same time as NASA EOS began, the European Space Agency (ESA) launched the bus sized Envisat, carrying a suite of passive optical, thermal, microwave and radar sensors to monitor the Earth. Envisat has now been replaced by the European Union’s Copernicus program, using the Sentinel series of satellites built and operated by ESA. This an ambitious project to provide data to monitor long-term changes on the Earth. For Copernicus, ESA has adopted a fully open data policy, much like NASA’s EOS policy. This has made the data far more popular than their earlier missions, such as Envisat, which were free to use but had to be applied for before access was granted. Table 1 illustrates how much more the fully open datasets are used for landscape monitoring than those which must be applied for or bought. The table includes satellites from the space agencies of the USA (NASA), Europe (ESA), Japan (JAXA), Canada (CSA), France (CNES) and Germany (DLR) and the US weather (NOAA) and geological (USGS) agencies.
| Satellite instrument | Number of papers | Mission start | Mission end | Papers per year | Open data policy? |
| Landsat (NASA/USGS) | 259,000
|
1972 | Still operational | 5,511 | Yes |
| MODIS (NASA) | 86,700
|
1999 | Still operational | 4,335 | Yes |
| Sentinel-2 (ESA) | 7,539 | 2015 | Still operational | 1,885 | Yes |
| AVHRR (NOAA) | 33,500 | 1978 | Still operational | 817 | Yes |
| Sentinel-1 (ESA) | 4,050 | 2014 | Still operational | 810 | Yes |
| Meris (ESA)
|
6,830 | 2002 | 2012 | 683 | No |
| PALSAR (JAXA) | 6,270 | 2006 | Still operational | 482 | No |
| Radarsat (CSA) | 9,190 | 1995 | Still operational | 383 | No |
| TerraSAR-X (DLR) | 4,500 | 2007 | Still operational | 375 | No |
| SPOT (CNES)
|
6,830 | 1986 | Still operational | 207 | No |
Table 1: List of Earth observation satellite instruments and number of academic papers that mention that instrument plus the word “landscape”, as given by Google Scholar on the 29th November 2019.
Satellite monitoring of landscapes has predominantly been done with passive optical sensors, with a smaller number of studies using radars (L, C or X band {their wartime designations, still in use today} with wavelengths between 20 cm and 3 cm). Both of these types of instruments are good at measuring what land-cover type is where (eg. forest versus non-forest), but their signals saturate over moderately dense canopies, making them unsuitable for monitoring changes and variations in dense tropical forests, and they provide no information on the structure of a forest, such as the “fire-ladder” arrangement of fuels needed for fire management. To make unsaturated measurements of dense forests, and to extract those additional details on structure, useful for fire management and biodiversity monitoring, other technologies are needed.
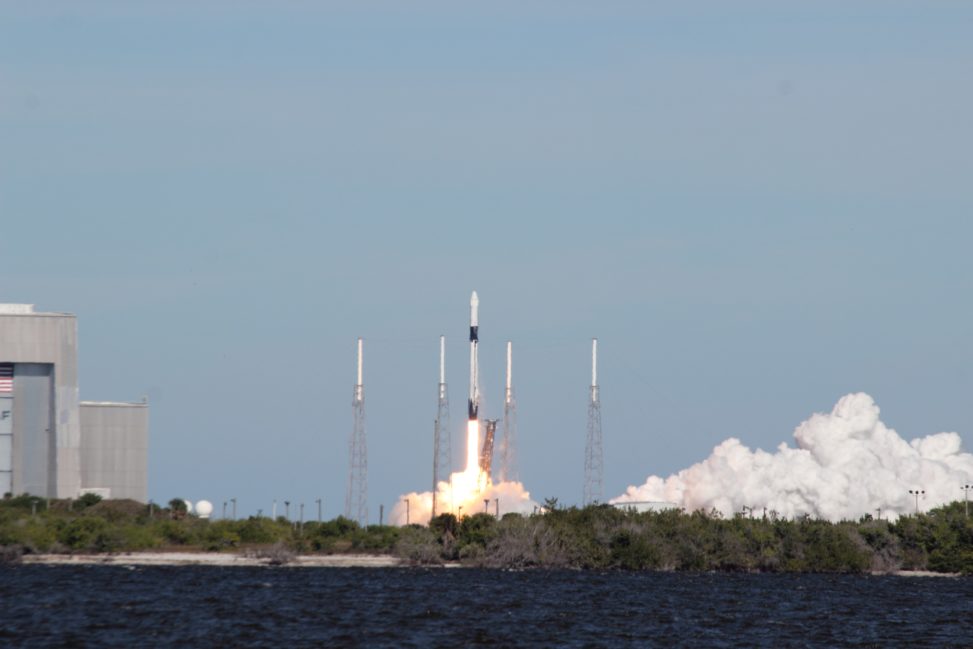
Over the last year, a new generation of satellites have been launched, NASA’s GEDI (December 2018) and ICESat-2 (September 2018) missions use laser ranging technology to measure the elevation of the Earth’s surface and the height, density and vertical structure of vegetation. NASA’s GEDI mission is the first spaceborne laser mission designed to measure forests and is sensitive enough to see ground through the densest of tropical forests. An earlier satellite laser, NASA’s ICESat, operated between 2003 and 2009 and has been extensively used for mapping forests, but the mission was designed to measure the ice-caps and so required careful filtering to avoid its limitations over forests, limiting ICESat estimates of forests to very low resolutions over flat ground only. GEDI is expected to provide the most accurate and high-resolution map of the distribution of the world’s tropical forests to date, as well as providing insights in to how the structure of forests affect ecological and meteorological processes. In the near future, ESA will launch the longest wavelength civilian radar yet flown in space (P band, 60 cm) with the BIOMASS mission. Due to the relationship between a radar’s wavelength and its penetration through objects, this should also provide unsaturated estimates of tropical forest carbon content, and, due to the lower power requirements of a radar relative to a laser, will provide estimates at multiple time-steps over the mission life.
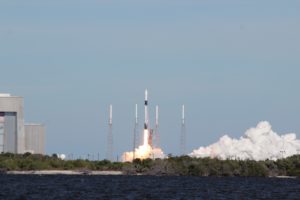
NASA’s GEDI on its way to orbit
Whilst satellites have been used to map a wide range properties of the Earth’s landscapes, fundamentally a satellite only measures photons of light scattered by the Earth’s surface and atmosphere. In order to convert that measured light into a meaningful measure of the land surface of use to decision makers, it must be calibrated against ground observations. Therefore ground-based fieldwork underpins all satellite derived maps of the landscape, and without it these multi-million dollar spacecraft would be of limited use for Landscape monitoring. In addition, as a previous CSFL blog mentioned (https://blogs.ed.ac.uk/forest_ed/2019/08/29/what-is-tree-planting-for/), the structure of a forest is not everything. Whilst satellites are able to monitor the land cover type, density, and now height and carbon content of vegetation (after calibration), these metrics do not tell the full story. The same structure forest could be made up of very different species, be home to different sets of animals or provide different resources for local communities. That local context is currently missing from satellite estimates and researchers are working on developing methods to extract ever more detail out of satellite, weather and societal datasets to provide ever more detail for decision makers.
The present period is a golden age of satellite observation of the Earth, with multi-decadal datasets free and open for use. Space agencies around the world are working to maintain the most useful instruments, for example the NASA-EOS and EU-Copernicus programs, whilst new technologies are being trialled to generate ever more detailed information. When combined with field observations, these should provide new insights in to the function and changes of the Earth’s landscapes.
by Steven Hancock
Lecturer, School of GeoSciences, University of Edinburgh
Associate assistant research professor, University of Maryland


Leave a Reply