Like many infectious diseases, COVID-19 spreads most often through direct social contact. We are most likely to catch the virus through sustained social interaction: because of this, following a ‘15 minute rule,’ contact tracers seek to identify individuals who infected persons have interacted with for a period of 15 minutes or more at a distance of under two metres. These interactions are most likely to happen with friends, family, co-workers and others with whom we share regular social relationships. In other words, the virus that causes Covid-19 tends to spread through our social networks.
Because of this, epidemiologists have long studied the properties of social networks and how they affect disease spread. Sexually transmitted diseases such as HIV/AIDS are an important example: because STDs spread through sexual contact, patterns of sexual interactions and the underlying social relations shape how a disease spreads in a population. Although SARS-CoV-2 (the virus that causes COVID-19) can spread through less intimate relationships, the same principle applies.
An important property of social networks is the variability between individuals in the number of such relationships (network analysts call this the degree distribution). This property may help explain how viral diseases spread. Individuals who interact with many people could spread a virus to more others than those who interact with fewer. Epidemiologists emphasize that the now infamous ‘r’ number, the number of infections resulting from a single prior infection, is also varies widely. Most COVID-19 infections result from a small number of previously infected individuals: in a study of the pandemic in Hong Kong, 80% of cases resulted from around 20% of previously infected individuals. This helps explain the importance of so-called super-spreading events: either because they have an usually large number of social contacts, or just happen to enter a crowded space while infected, some individuals will spread the virus to a large number of others. Others will not spread the virus at all.
Thus, social interaction patterns affect the transmission of Covid-19. But happens after a such a super-spreading event occurs? Just as individuals will infect a widely varied number of other people, events could give rise to a widely varied number of other events. Understanding this could help explain how a virus like SARS-CoV-2 moves through a population – and thus perhaps help control it. A superspreading event occurring in, say, a church may have different implications for viral spread than an event at a bar. If (for example) most churchgoers tend to interact with others in the same church-going community, whereas bar patrons have much wider social networks, then the bar event could give rise to many more infections and subsequent super-spreading events, than the church event. Just as there is a network between individuals, there is a network of events. This aspect of disease spread is much less studied.
As a sociologist studying social networks, I was thinking about these issues when I stumbled across a trove of data on the web page of the Singapore Ministry of Health. In the early months of the pandemic, health authorities in Singapore posted the results of their contact tracing programme online in daily press releases. This anonymous information included contacts between pairs of infected individuals and associations between individuals and infection clusters identified by the authorities. I realized that this information could be used to visualize the network of COVID-19 infections, and perhaps teach us something about these broader patterns of spread.
Singapore turned out to be an interesting location to explore these questions because of social interaction patterns in the population and peculiarities of the local pandemic. After seeing its first COVID-19 cases in early January, public health authorities rapidly implemented a suite of comprehensive public health measures that were initially fairly successful in controlling the virus. However, beginning in mid-March the city was hit by a large outbreak occurring primarily among the city’s migrant worker population. The Singaporean economy is highly reliant on guestworkers (many from India and Bangladesh) who live in cramped dormitories. This was an ideal ecosystem (from a virus perspective) for rapid spread of SARS-CoV-2. Roughly speaking, these dormitory clusters are like the super-spreading events discussed above.
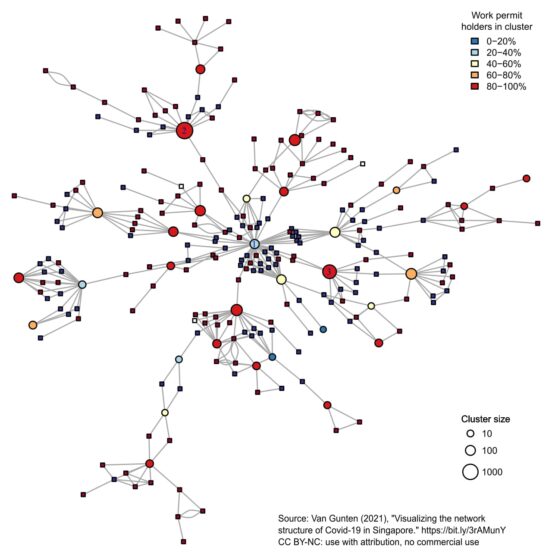
While the spread of the virus within dormitories was easy enough to understand, I wondered how it spread between them. In other words, if each dormitory was a kind of super-spreading event, what did the network between them look like? The fact that workers lived in close quarters within dormitories didn’t explain how the virus spread so quickly to many different dormitories. It was also unclear how the virus got into the migrant worker population in the first place. To try to answer these questions, I used the contact tracing data from the Ministry of Health web page to visualize the network of COVID-19 infection. The result is the image above.
Network visualization gives researchers insights into patterns in data that can’t otherwise be easily seen. A network diagram represents relationships between different kinds of entities – which could be individual people, or anything else – as points connected by lines. In this case I had two kinds of entities: people infected with SARS-CoV-2, and locations such as dormitories where many infections occurred. I represent individuals as squares, and clusters as circles. The lines in the picture show whether two individuals had a known social connection, or whether individuals were associated with a particular cluster.
Network diagrams like this often suffer from the ‘hairball’ problem – there are too many points and lines to make sense of the data. To simplify, I represented those individuals who were only connected to one cluster (and to no other individuals) by using the size of the circles to reflect the size of the cluster. I then used colour to show whether individuals held a permit for migrant workers, or (in the case of clusters) what percentage of the individuals in each cluster were guest workers.
We can think of this figure as capturing something like the network between super-spreading events or infection clusters as introduced above. There are a few important lessons we can take away from this. First, a large proportion of cases occurring during the time period studies are connected to in this network. This supports the starting assumption of my work – that COVID-19 tends to spread through social contacts – and also suggests that the Singaporean health authorities were very effective in uncovering these networks.
More importantly, one cluster at the centre of the network (labelled cluster 1) is connected to many more other clusters than any other cluster. Cluster 1 is connected to around eight infection chains (a chain is a series of infected individuals resulting in at least one additional cluster or event). No other cluster seems connected to more than two infection chains. Based on the timing of infections, cluster 1 seems to be the first cluster in the network. In other words, cluster 1 was a kind of ‘super-super spreading event’ that not only produced many infections, but also produced many other chains of infections resulting in other clusters. Cluster 1, which corresponds to a construction site, is also not composed of a majority of guest workers. However, several infection chains coming from this cluster resulted in later infection clusters in dormitories, where a sizable majority of infected individuals were guest workers.
A reasonable inference from this diagram is that the construction site was the critical pathway through which the virus spread into the guest worker population in Singapore, spreading from this work location to many residential locations (dormitories). In so doing, the virus also ‘jumped’ from one segment of the Singaporean population to another. Once present in the guest worker population resident in dormitories, the virus spread between dormitories and other locations, producing further infection clusters. Although non-guest workers were exposed to the virus (and sometimes seem to have spread it between clusters), this infection pattern produced few clusters in the non-guest worker population. While many infections resulted from these later clusters, they did not each branch out into multiple chains of infections, further clusters, and so on.
This research was exploratory, and so conclusions must remain tentative. Moreover, Singapore is unique in important ways, and we should not forget that this network occurred in the context of relatively effective public health measures. Nevertheless, an important lesson is that patterns of social interaction occurring at broader scales – such as whether individuals interacting in one setting, such as a construction site, also interact with individuals in other settings, such as a dormitory – govern the spread of the virus. Had public health authorities been aware of these interaction patterns, they might have been able to prevent a large outbreak. Hopefully, epidemiologists and other researchers will incorporate these larger-scale networks into their understanding of disease spread.
Tod Van Gunten is Lecturer in Economic Sociology at the University of Edinburgh since 2017. His recent publication “Visualizing the network structure of Covid-19 in Singapore” appeared in the journal Socius: Sociological Research for a Dynamic World.


Comments by Hashemi