

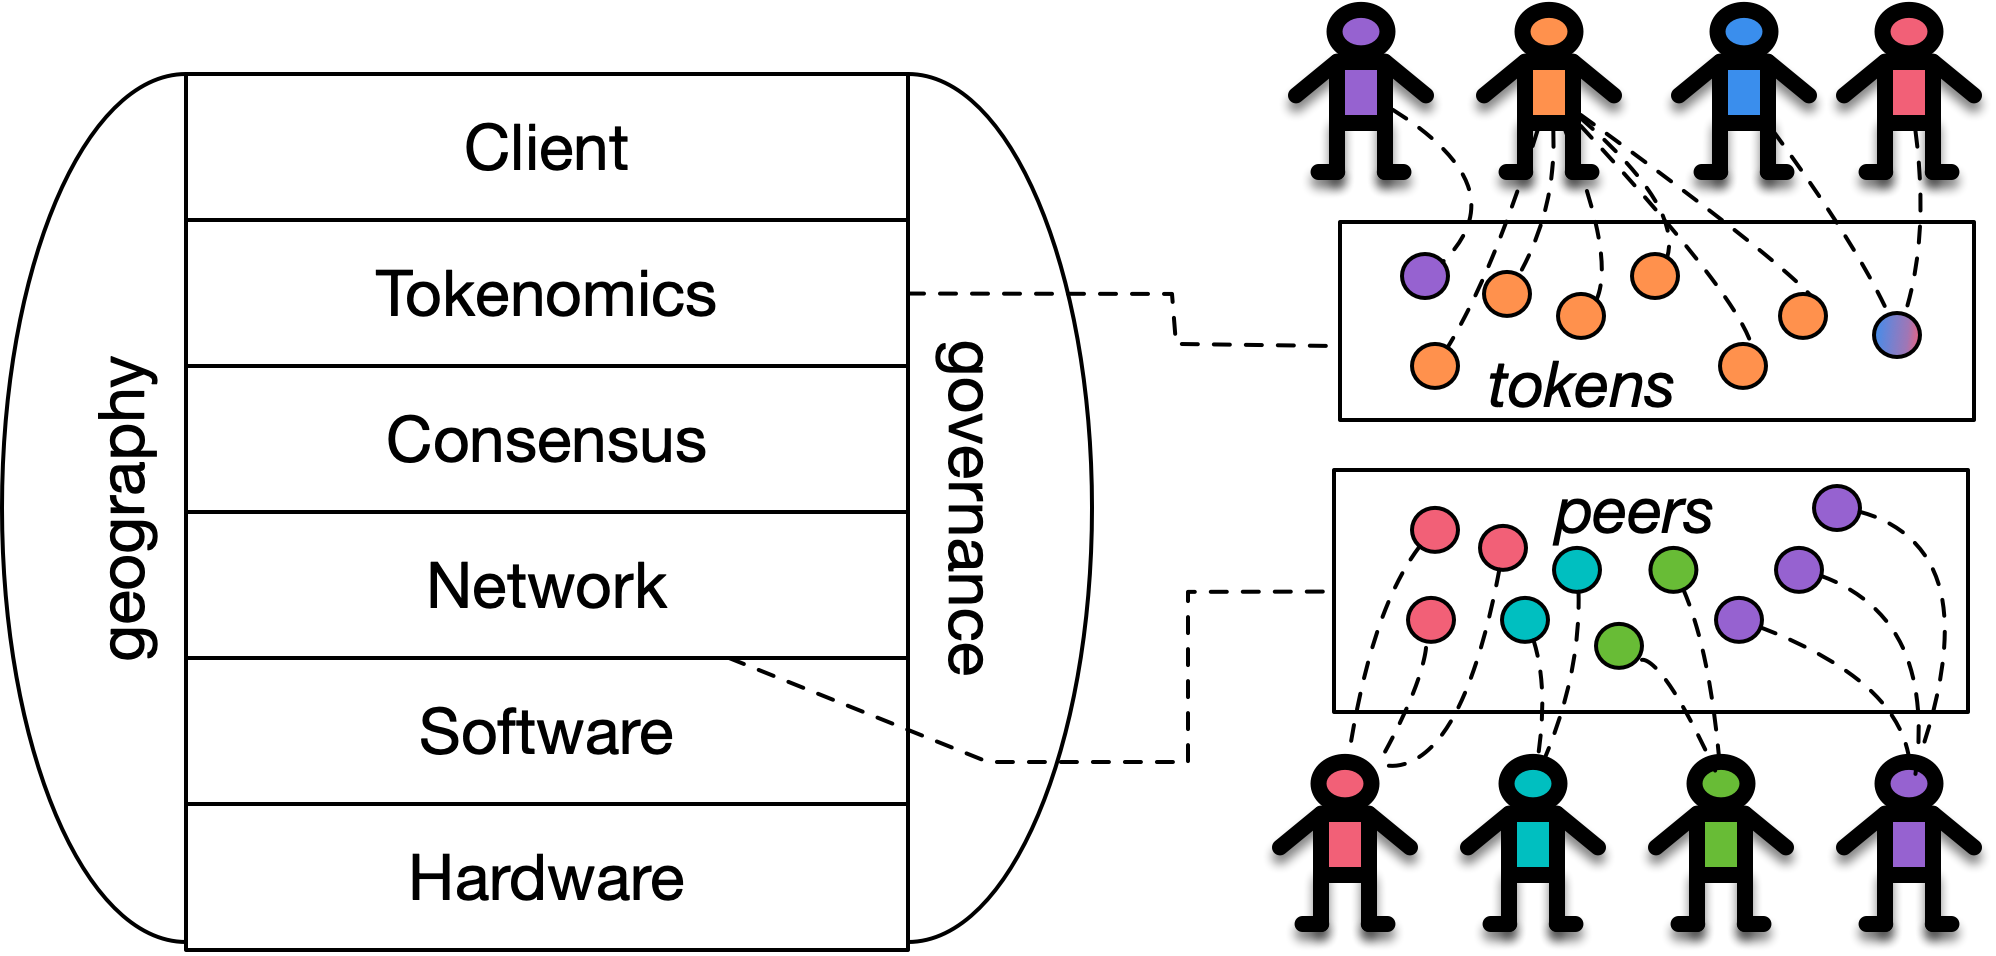
The Edinburgh Decentralisation Index (EDI) project aims to define and measure blockchain decentralisation in a systematic way. As a first step, the EDI team identified 8 dimensions of blockchain systems that can exhibit different degrees of (de)centralisation and are therefore interesting to evaluate. These layers include : 1) Hardware, 2) Software, 3) Network , 4) Consensus, 5) Tokenomics, 6) API Clients, 7) Governance and 8) Geography, and they can be seen in the sketch below. Note that Geography and Governance are positioned in this manner because they are intricately connected to all other layers.
The EDI is an iterative program, which will steadily introduce new methodologies for assessing the different dimensions of decentralisation to ultimately form a holistic evaluation. As members of the EDI team, we are happy to announce that we have just released a tool for measuring the decentralisation of various blockchain systems on the Consensus layer, i.e. the layer concerned with block production. It is a CLI tool (meaning that it needs to be executed through a terminal), but hopefully this will not put off too many people from interacting with it — we promise it is not difficult to use! The source code is available on GitHub and in this blog post we will briefly explain what it does and give an example of how to use it, in order to make it more accessible to a wider audience.
In short, the tool requires as input one or more datasets with block data for some ledger (with an entry for each block that includes its timestamp, number, and some fields that can be used to extract information about its creator), which it then parses so as to keep only the useful parts from there. As a next step, each block is mapped to the entity that created it, when possible to do so, using the attribution data we have on record (which is information about address ownership, known tags used by pools, and so on, acquired through various sources, which are always specified for each entry). Then, the blocks are aggregated using some granularity (monthly by default), revealing the distribution of blocks to entities for each time period. Last, an array of decentralisation metrics is applied on these distributions to produce the final output, which consists of csv files and graphs that demonstrate a historical comparison of how the blockchains in question fare for the given metrics.
Using the tool: step-by-step instructions
The first thing one needs to do is clone the relevant repository, which can be achieved by entering the following command in a terminal:
git clone https://github.com/Blockchain-Technology-Lab/consensus-decentralization.git
Note that the tool is written in Python, therefore it is required to have a version of Python installed in order to run it — any version from 3.6 and above should do but we recommend Python 3.9. In all commands listed from now on, we will assume that the keyword python is associated with the relevant Python version, but if this is not the case in your system, you should substitute it with the correct keyword (e.g. python3.9).
Once the repository is cloned, you can navigate to its directory and install all of its dependencies by running the following commands:
cd consensus-decentralization
python -m pip install -r requirements.txt
Now that we have everything installed, we just need to place some block data in the folder named raw_block_data and we will be ready to run the tool. As an example, we can use Bitcoin and Bitcoin Cash data from January 2018 to August 2023, which can be downloaded from here (note that these datasets were obtained from Google BigQuery, though we have plans to obtain them from primary sources in the future).
Now we can run the following:
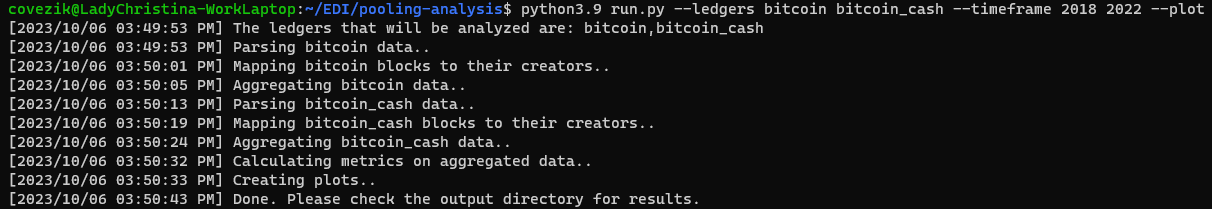
python run.py --ledgers bitcoin bitcoin_cash --timeframe 2018 2022 --plot
This command tells our tool to perform the decentralisation analysis on the Bitcoin and Bitcoin Cash data from the beginning of 2018 to the end of 2022 (aggregated monthly), and to also generate plots for the results.
Note that the first time we run the tool for some ledger, the process might take a while (several minutes) because of the parsing and mapping of all the blocks, but subsequent runs should be faster, as the previously calculated results are reused (unless otherwise specified).
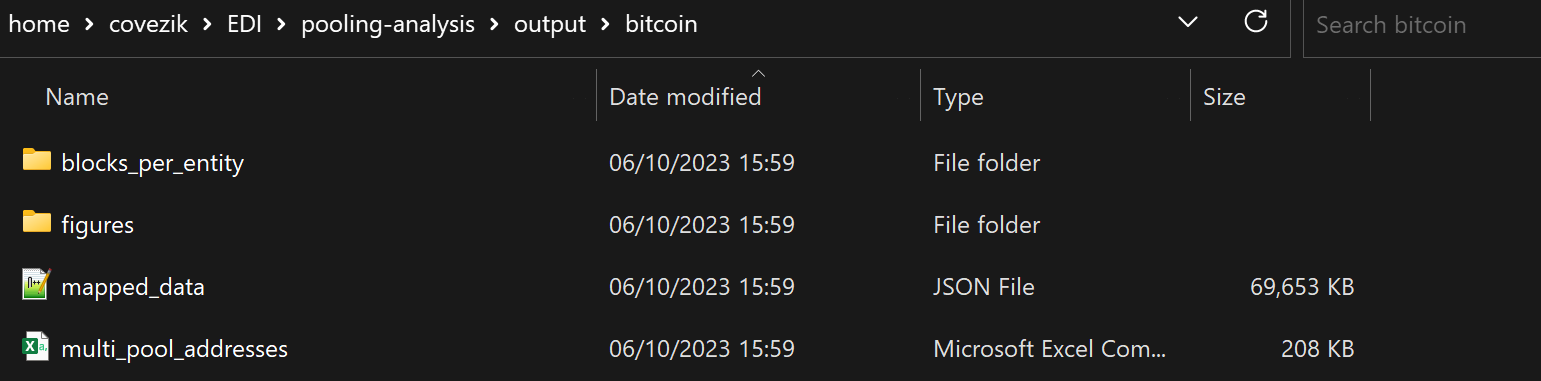
All results are saved under the output folder, in corresponding subfolders. For example, the folder output\bitcoin should look like this:
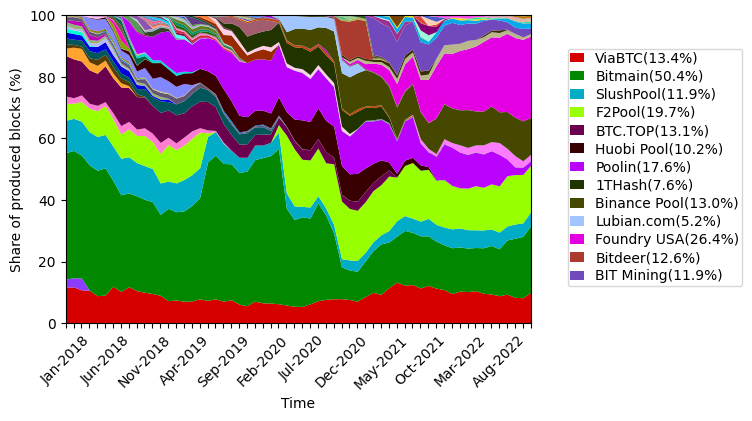
The dynamics of Bitcoin’s block production can be observed in this figure (found under figures):
Similarly, the folder output\bitcoin_cash includes the json file, csv files and figures that were generated for Bitcoin Cash’s data.
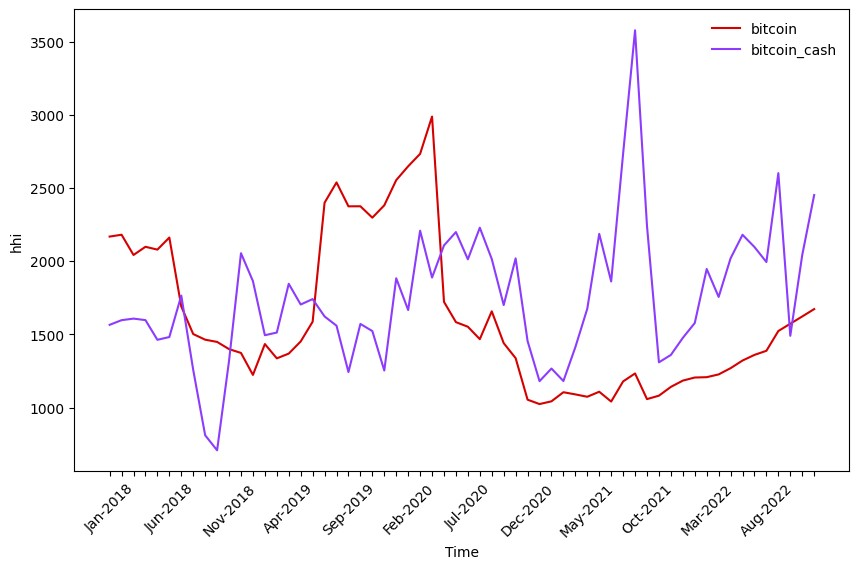
Additional graphs that compare the two systems for each metric can be found under output\figures. For example, this is what the Herfindahl–Hirschman index graph from this execution looks like:
It is also possible to experiment with more ledgers (the currently supported ones are Bitcoin, Bitcoin Cash, Cardano, Dogecoin, Ethereum, Litecoin, Tezos and Zcash), analyse the data using custom time frames and different granularities (e.g. get weekly aggregation between two specific dates), or get animated graphs as the output of an execution.
To learn more details about our tool and all the different ways to configure it, you can visit its documentation pages. If you have any questions or need further help, you are welcome to post on our Discussion board, or if you identify some problem please report it in our Issues.
Thanks a lot for reading this blog post and for taking an interest in our work. We’ll continue to bring you updates on our progress as new measures are introduced over the months ahead.
Meanwhile, happy explorations of blockchain decentralisation — do let us know if you spot anything interesting!
by Christina Ovezik
Posted 25 October, 2023


Pingback: EDI Team Unveils Cutting-Edge Tool for Measuring Blockchain Decentralization on the Consensus Layer | CryptoTale
decentralization is the underpinning of what makes all blockchain possible, and it’s one of the most overlooked properties, great tool!