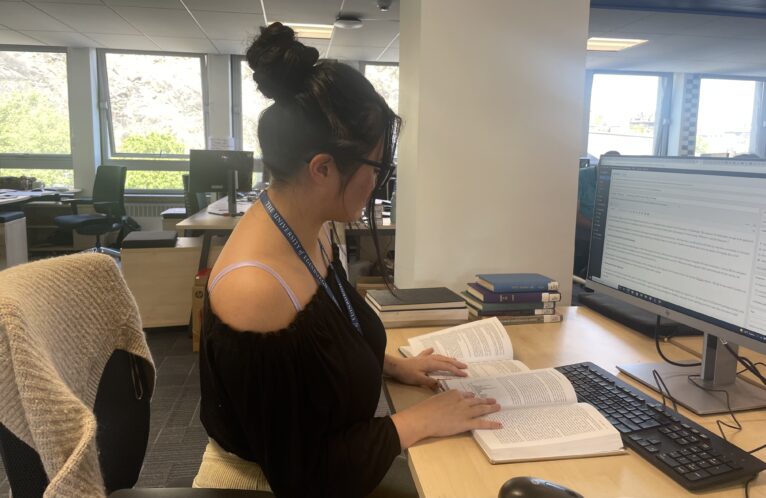
Hi, my name is Maggie and I’ve just completed my third year of a Computer Science degree at the University of Edinburgh. This summer I’ve been lucky enough to be appointed the new Scottish Witchcraft Data Visualisation Intern here at the University of Edinburgh’s Information Services Group. Welcome to my first blog post 🙂
Through my degree I’ve established an interest in data science and especially data visualisations. I love how they can tell stories with data in a way that is accessible to everyone. People can understand the narratives without having to tediously go through masses of static data. Visualisations almost seem have the power of bringing data to life!
Survey of Scottish Witchcraft Database
The Survey of Scottish Witchcraft project began in 2001 when project directors, Julian Goodare and Louise Yeoman, alongside full-time researchers, Lauren Martin and Joyce Miller, started to create a database of people accused of witchcraft in Scotland between 1563 and 1736. With thirty three separate tables and thousands of data entries, the finished database is an absolute treasure trove of interesting historical data.
My predecessor, Emma, alongside some web developers, did an amazing job with using the Survey data to create the current Witches website. My job for the next 12 weeks is to expand and add to the website alongside our Open Source Developer Intern, Josep.
Working with the Database
These first two weeks have been super busy, and I’ve had so much support from knowledgeable people which has helped a lot. The first port of call has been getting familiar with the original Survey database on Microsoft Access. I spent the first couple of days going through the database, using the Access querying service to see what new data I could visualise.
A potential visualisation I was thinking could be helpful would be showing the people involved in the cases, and how they were involved. I used the Access SQL query tools to query the WDB_Case_person table to find how many people were involved in the witch hunts in different ways.
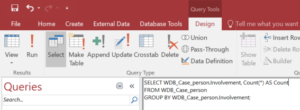
After running the query, the results below were output. As you can see there are thousands and thousands of relationships that we could visualise. Information of note from this query was the overwhelming percentage of relationships being of type commissioner.
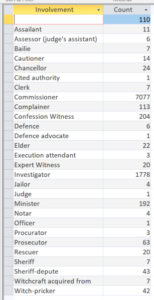
I had no idea what that meant so I corresponded with Prof Julian Goodare, and he says “A ‘commissioner‘ was a person who held a ‘commission of justiciary’ – a document issued by the central government which authorised the person to act as a judge, convening a criminal court that could try, convict and execute an accused witch.”
It’s fascinating to see how hand in hand witch hunting and the central government at the time were. Witchcraft persecution wasn’t just a part of the culture but also ingrained in legislation. You can just imagine the accused witches’ fear that even their legal system was campaigning against them.
A Wikidata Crash Course
Aside from getting to know the database, I have been getting up to speed with all things Wikidata. Wikidata is a sister project of Wikipedia, and is a free and open knowledge base that turns information into structured and machine-readable data. I had no idea the possibilities of using Wikidata until starting this project. It’s basically a giant network of linked data edited and maintained by thousands of contributors.
Data is structured on Wikidata as items, with unique Q numbers as identifiers.
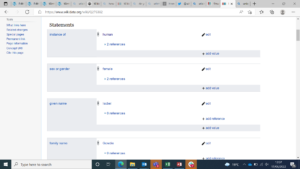
For example, Isobel Gowdie (one of Scotland’s most famous witches) is structured as an item with the label being her name, the description being “alleged witch”, and her aliases underneath that. The unique Q number next to her name identifies her as a single data entity.
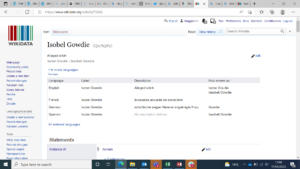
In these item pages, information is stored in a series of statements. A statement is made up of claims which consist of properties and values, known as the triple. Properties have unique P numbers, and for example the first statement for Isobel Gowdie uses the property instance of and the value human. Values can link to other items (such as human!), which leads to the linkage structure between items on Wikidata.
To practice using this data structure I had fun manually creating new items and adding further statements to items already on Wikidata. This can be super time consuming so I’ve been introduced to other ways to add more data, such as OpenRefine and QuickStatements, which I’m sure we will encounter later on in this project!
Data Modelling, and Lots of It!
To work with the Survey’s rich information, what has been done in previous years has been importing data from the database onto Wikidata. A lot of the Survey data has already been added, but a table that hadn’t been were of the cases of witchcraft investigation. I spent a couple of days modelling how I wanted different involvements of people related to the cases to look like. Some examples below!
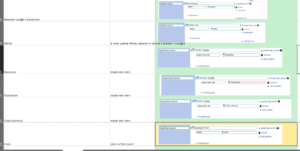
In the upcoming weeks I would like to use this modelling to add all the cases and related people onto Wikidata.
To conclude, I’ve had a super busy couple of weeks working on this project. Hopefully by my next blog post I’ll have a full plan of attack on how I want to get the most out of these 12 weeks. I’m excited to see where it goes!


Leave a Reply