Any views expressed within media held on this service are those of the contributors, should not be taken as approved or endorsed by the University, and do not necessarily reflect the views of the University in respect of any particular issue.

Month: October 2023

Week 7: Delving into methodologies

After finishing all my intensives for this semester (it was a turbulent first month indeed), I feel like I now need time to take it all in and settle my acquired knowledge through the post-intensives and final assessments.

I particularly enjoyed the course Text Mining for Social Research, where we dug deep into programming to analyse different corpora of texts. Having access to big corpora of digitalised information (in this course we used the newspaper The Guardian’s API, and in Narrative and Computational Text Analysis we used Chronicling America, an API with newspapers from the US, ranging from 1770 to 1962) opens up the door to endless possibilities. I feel like one can truly apply creativity in them to answer fascinating questions. I particularly liked developing my final project for the Text Mining course, where I explored the use of the term “femicide” in The Guardian articles and analysed this. This said, I know I would want to apply coding to my Futures Project for its data component.

I have yet to know what this data would be and where I would take it from (if it would be data I would gather through surveys, observation or other quantitative or qualitative methods, or if it would be data taken from a preexisting database).

As for the data visualisation component, I would need to improve my skills. In this sense, I am looking forward to next semester’s course, “Representing Data”, and attending the “Information + Conference” in November. However, in trying to apply a “dataviz” mindset, I went about my Interdisciplinary Futures illustrated autobiography as a data visualisation. I wanted to make it easy to understand and insightful, not only in its content but in its form (making form contributory to the content).

During the last supervision meeting, the type of visualisation that stood out the most was my proposal of making a 3D printed dataviz to aid visually impaired people to access that information. However, I am not 100 % sure if I want to go in this direction. I would first need to get a close approach with the target audience and investigate if this is really something necessary or how it could best work. I could potentially get involved with visually impaired organisations (I was looking into Sight Scotland and Visibility Scotland), but first, I want to make sure I want to go in that direction, which is something I haven’t yet decided.

I hope that as I embark on readings for my next assignments (mainly for The World of Story and Creating Visual Narratives), I can come across more interesting components to keep building my project.
Week 5: Mode of representation

After a very demanding week with two different intensives (Text Mining for Social Research and Creating Visual Narratives), I feel motivated by the possibilities for my Futures Project (and my work in the future, beyond university). Especially after Creating Visual Narratives, I felt deeply inspired as to how extensive and rich the visual language can be.

This confirmed my choice, as presented in my previous blog post, to link data, communication, and design through data visualisation.

Even today, after attending the EFI Makerspace induction, I feel that 3D printing could be an exciting way to convey data visualisation. For example, a 3D model of a data visualisation could be inclusive to people with visual disabilities through involving the sense of touch. Really, data visualisations could take a variety of forms and materiality, from knitting[1] to intervening photographs[2] (which is what I believe I will be exploring for my Creating Visual Narratives project), from sculptures[3] to live GPS tracking.[4]

Within the design thinking framework, I feel like I am in the ‘Ideate’ process, where the possibilities are endless, and one tries to cover the most comprehensive range of ideas. My next step would be to start to narrow it down. Maybe knowing what the data visualisation would be about would be helpful in this next step.

I am looking forward to the supervision meeting and the ideas I will be able to get from my classmates and discuss their own project ideas to keep moving forward in envisioning the future.

[1] https://www.nytimes.com/2019/01/16/world/europe/germany-train-delay-scarf.html

[2] https://happy-data.co/

[3] https://zkm.de/en/data-sculptures

[4] https://qz.com/296941/interactive-graphic-every-active-satellite-orbiting-earth

Week 3: Exploring interdisciplinarity

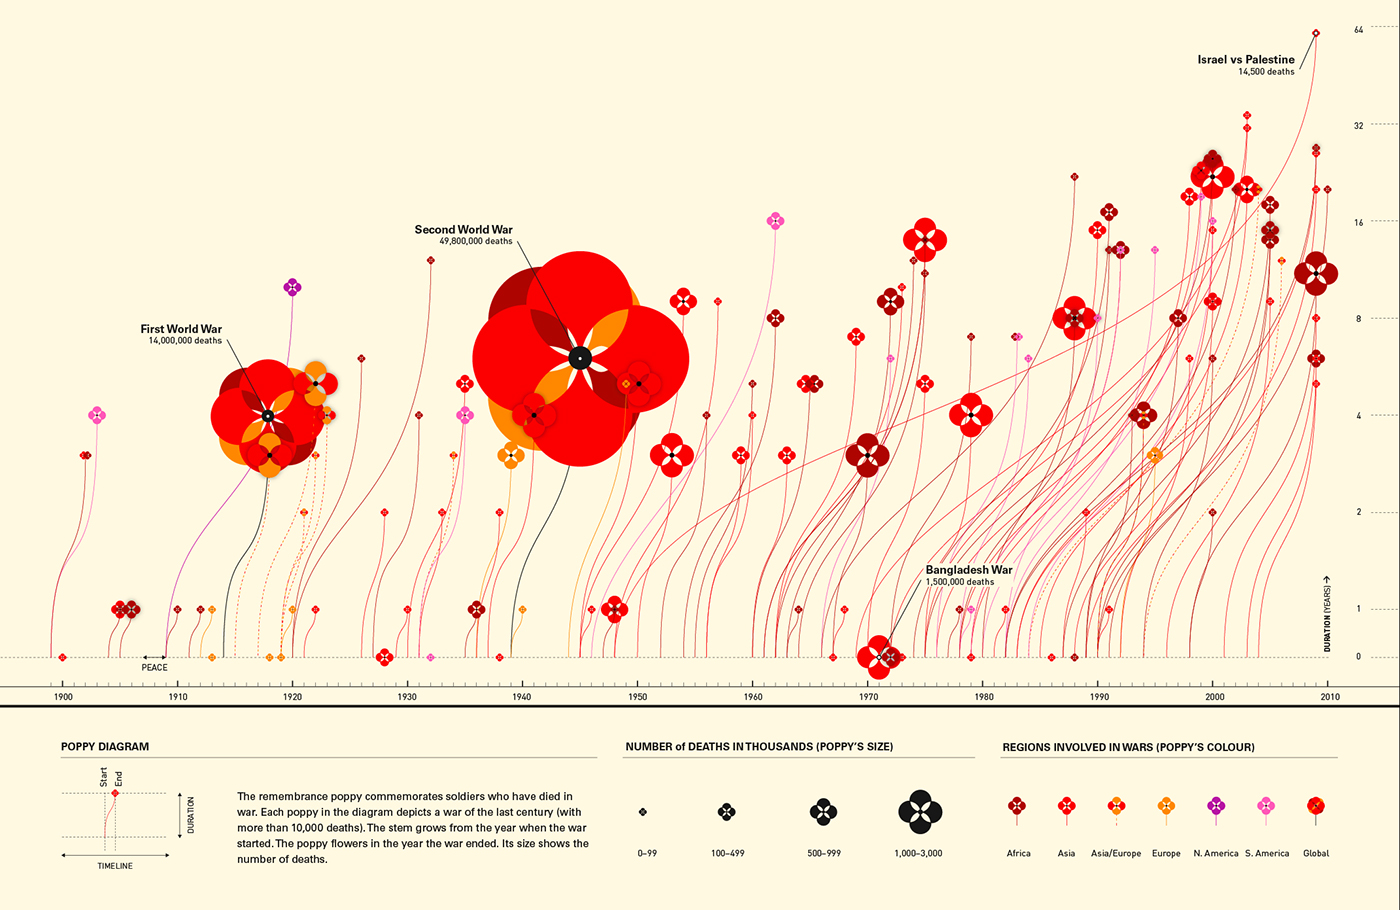
Data visualisation portraying the casualties and locations of major war events in the twentieth century.

The “Poppy fields” piece is one of my favourite data visualisations: simple, beautiful and insightful.

This week’s Interdisciplinary Futures lecture made me think a lot about the practice of interdisciplinarity and how it has the inherent potential to reach new, unexplored terrain.

In interdisciplinarity, doubt feeds the praxis (e.g. in the way that Jane Alexander made her leading character coin the same doubts she herself had) and enriches the work of the two (or more) disciplines.

This, in addition to making my own intellectual autobiography, made me reflect on my ambition to work in an interdisciplinary context.

From what I’ve seen, inspired by the work on data visualisations from information designers like Giorgia Lupi, Valentina D’Efilippo or Federica Fragapane, I believe that the best ‘data visualisers’ (if that expression can be coined) are not the best designers, but precisely the people who understand the data and know how to best communicate it. I have seen some beautiful and aesthetic data visualisations in the past, but they weren’t so easy to understand. In this sense (and in many others in life), I believe less is more.

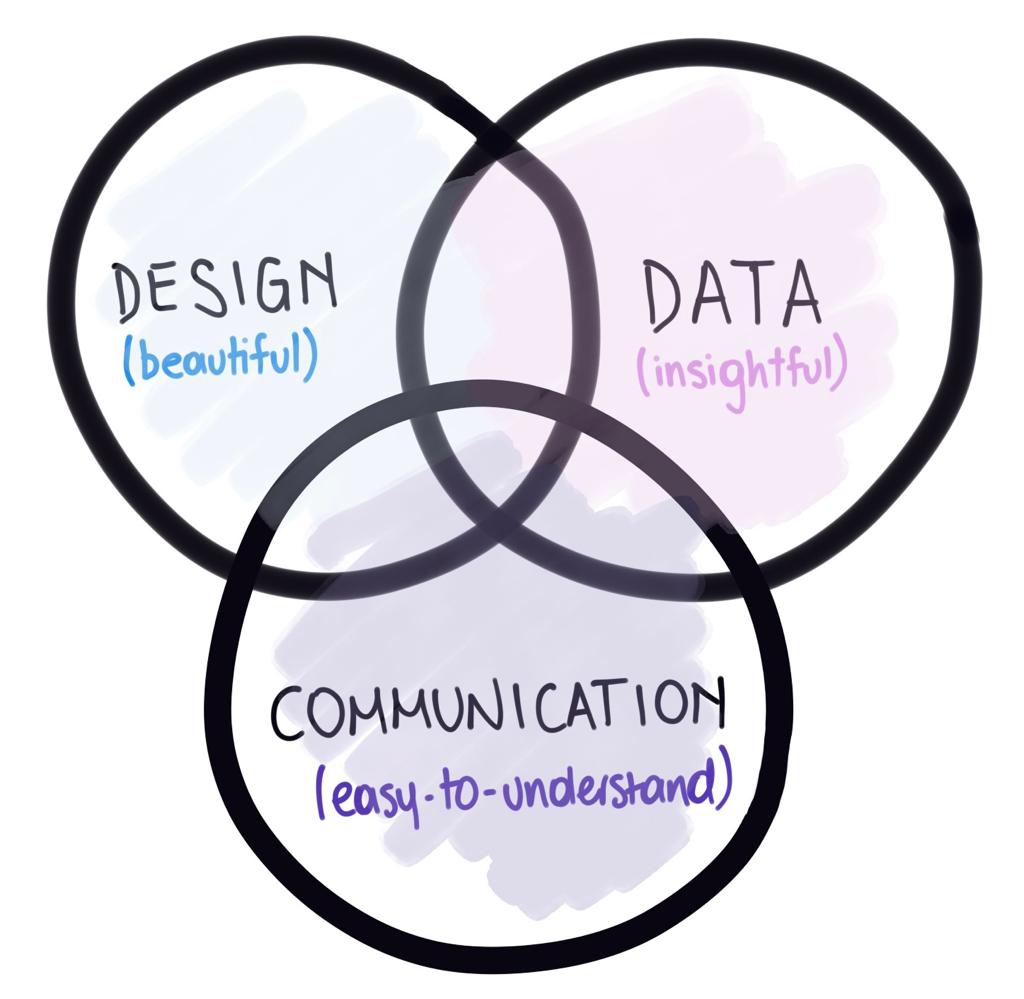
Inspired by this reflection, I came up with a diagram that shows what, to me, a good data visualisation should be and how it is inherently embedded in interdisciplinarity.

Diagram of three circles overlapping, each containing the words: DESIGN (beautiful); DATA (insightful), and COMMUNICATION (easy-to-understand).

In this, my ambition for my Futures Project is to successfully develop a data visualisation that can lay in balance in the overlap of these three disciplines.

More ambitiously, I would like this data visualisation piece or series to challenge the reader/viewer to take some action. However, this part of the communication process would be harder to control from the author’s perspective (as seen in Graham Mort’s “Finding Form in Short Fiction” in The World of Story course). Still, as the author, I will do my best to achieve my desired outcome.


Websites of practitioners mentioned:

Valentina D’Efilippo: https://bento.me/defilippovale

Federica Fragapane: https://www.behance.net/FedericaFragapane

Giorgia Lupi: https://giorgialupi.com/


Bibliography:

Mort, Graham. “Finding Form in Short Fiction”. Short Circuit: a Guide to the Art of the Short Story / Edited by Vanessa Gebbie, Second edition. Salt, 2013, pp. 4-16

Week 1: New beginnings, new horizons

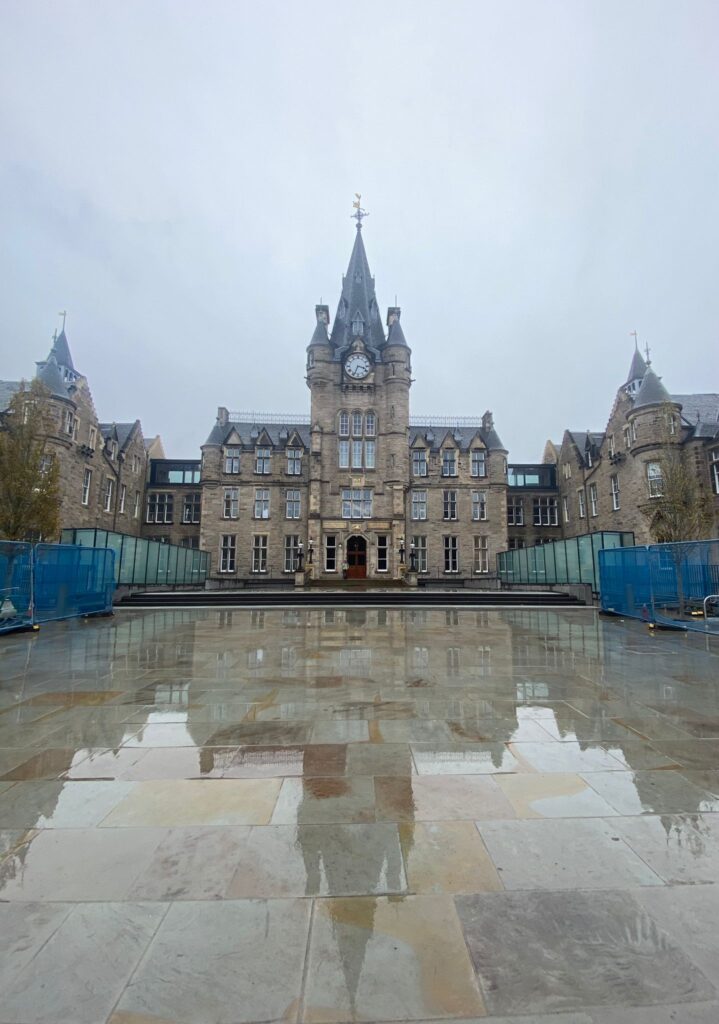
Edinburgh Futures Institute building, on a rainy day.

My academic journey began closely related to humanities and linguistics, having studied a BA in Corporate Communication and a technical degree in Copy editing/Proofreading (in Spanish). I am deeply passionate about words and languages. But from when I studied for my degree and in the seven years I spent working after that, I also felt that I had an analytical mindset that slightly diverged from the words-based study choices I had made.

At the same time, specialising in digital communications at work, I enjoyed delving into key performance indicators and analytics platforms —at times even more so than writing posts. Building reports and digging into numbers to draw relevant conclusions to inform new strategies captivated me, and time often passed quickly when I performed those tasks.

Still, I felt I could improve my work and take it to previously uncharted territories with more data analytics skills. That was how I searched and came across EFI and the Narrative Futures programme, where I thought I could suitably combine the world of storytelling with data analysis.

My professional aim is to harness the power of well-constructed data to create compelling messages to help counter misinformation. In communication, I believe that not only the media play a role, but also organisations and institutions (public and private) are fundamental in helping combat such a pressing issue as misinformation. And communications professionals within organisations are instrumental in that process.

This path is so broad and versatile that it has the potential to work in any topic, from social movements to health, from education to transportation. So, this is where I stand more hesitantly. I know what I want to do, but I don’t know what I want to do it about. I have a whole range of interests, like urbanism, sustainability, or feminism (very varied, as you can see), but I have yet to make these interests land into something more concrete.

I look forward to continuing my studies at EFI, sparking areas of interest and potential project topics that will help me in the quest for more informed societies that can better assert their rights.

Powered by WordPress & Theme by Anders Norén

css.php

Report this page

To report inappropriate content on this page, please use the form below. Upon receiving your report, we will be in touch as per the Take Down Policy of the service.

Please note that personal data collected through this form is used and stored for the purposes of processing this report and communication with you.

If you are unable to report a concern about content via this form please contact the Service Owner.

Please enter an email address you wish to be contacted on. Please describe the unacceptable content in sufficient detail to allow us to locate it, and why you consider it to be unacceptable.
By submitting this report, you accept that it is accurate and that fraudulent or nuisance complaints may result in action by the University.

  Cancel