
In the lecture of week 2, the application of two special graphs was introduced and explained. In our daily life, the sunlight can be observed from many sorts of different places. But as a student of Interior Design, the sunlight cast through windows or roofs are more concern to me.
In the reason of the different longitude and latitude at various locations, the angle of incidence of sunlight from outdoors to indoors is diverted completely. Those two graphs were developed to be auxiliary references for global sunlight.
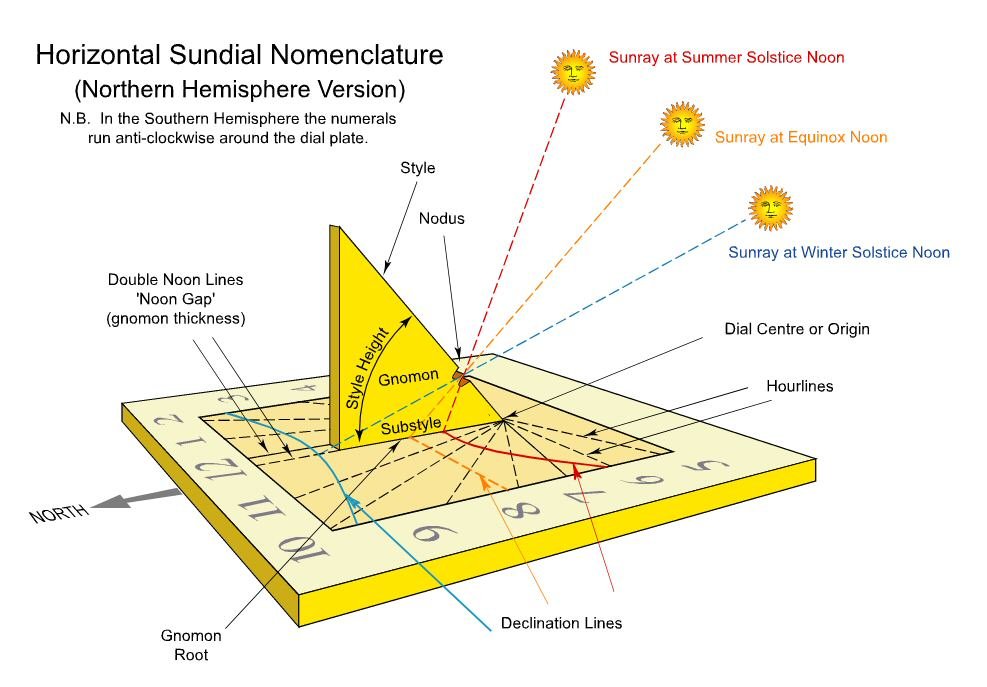
This diagram shows how sundials work. (Image from Bing)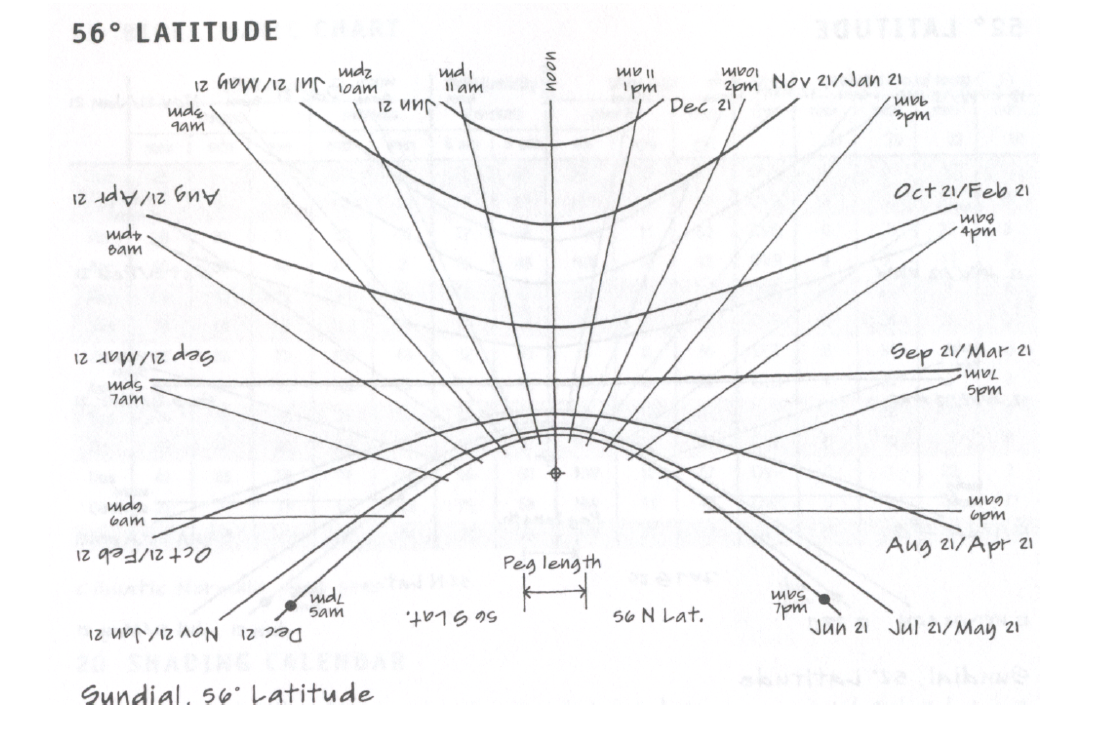 This graph shows the variation of solar exposure and projection over a given dimension throughout the year. Figure1 is the change process of annual solar irradiation and projection at latitude 56° (the latitude of Edinburgh).
In class, the teacher provided thumbtacks and asked us to drill holes in the black spot in the middle. We used the flashlight on our mobile phones to simulate the track of the sun.
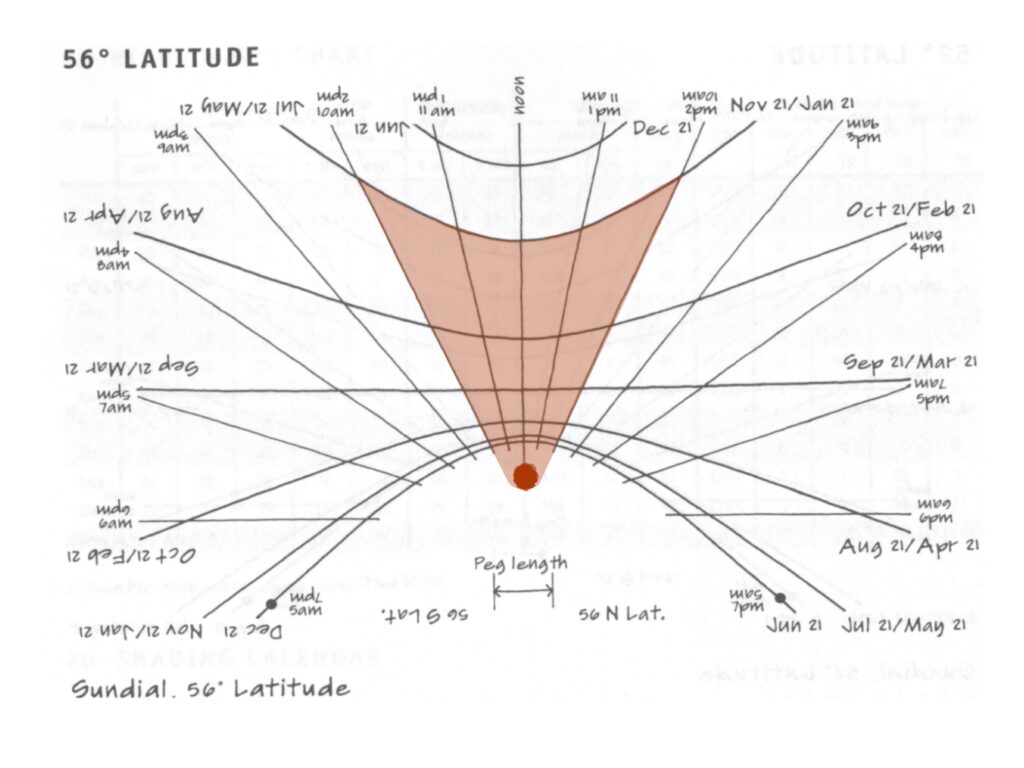
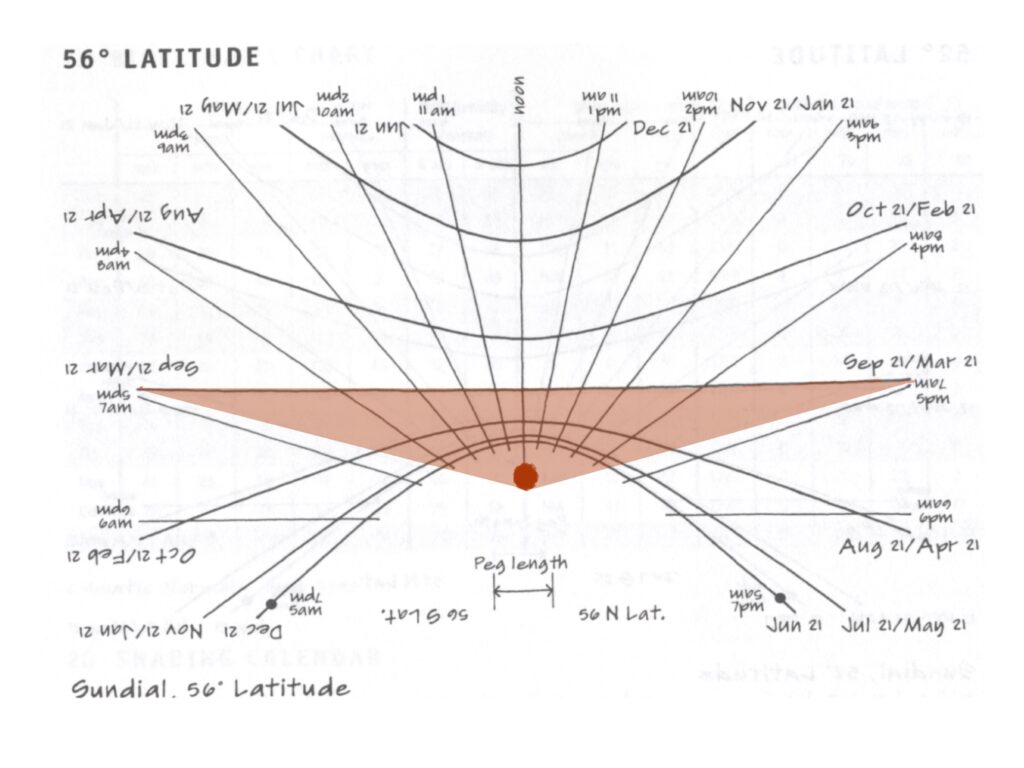
These are two projections of 21/11 and 21/09 from 10am to 2pm and 21/03 and 21/09 from 7am to 5pm at latitude 56° respectively. The light red area is the range of projection movement, and the dark red area is the location of the sundial.
The reasons for selecting these two pictures are as follows: First of all, the projection range of November and January sunshine is the time when the local sunshine is short, while March and September are the same length of day and night around the world, which is more representative. As can be seen from the shape and scope of the projection, in the months with a short sunshine duration, the lower the solar height angle, the longer the projection, and the indoor projection does not change significantly with time, and the displacement changes little. On the contrary, in March and September, when day and night are almost the same lengths, the sun’s height angle is the highest and its projection is the shortest, and the indoor projection changes significantly with time.
It follows that the projection of sunlight varies periodically with the months, reaching its maximum range in March and September, and its minimum range in December and June. It is supposed to be a sinusoidal graph with periodic changes.
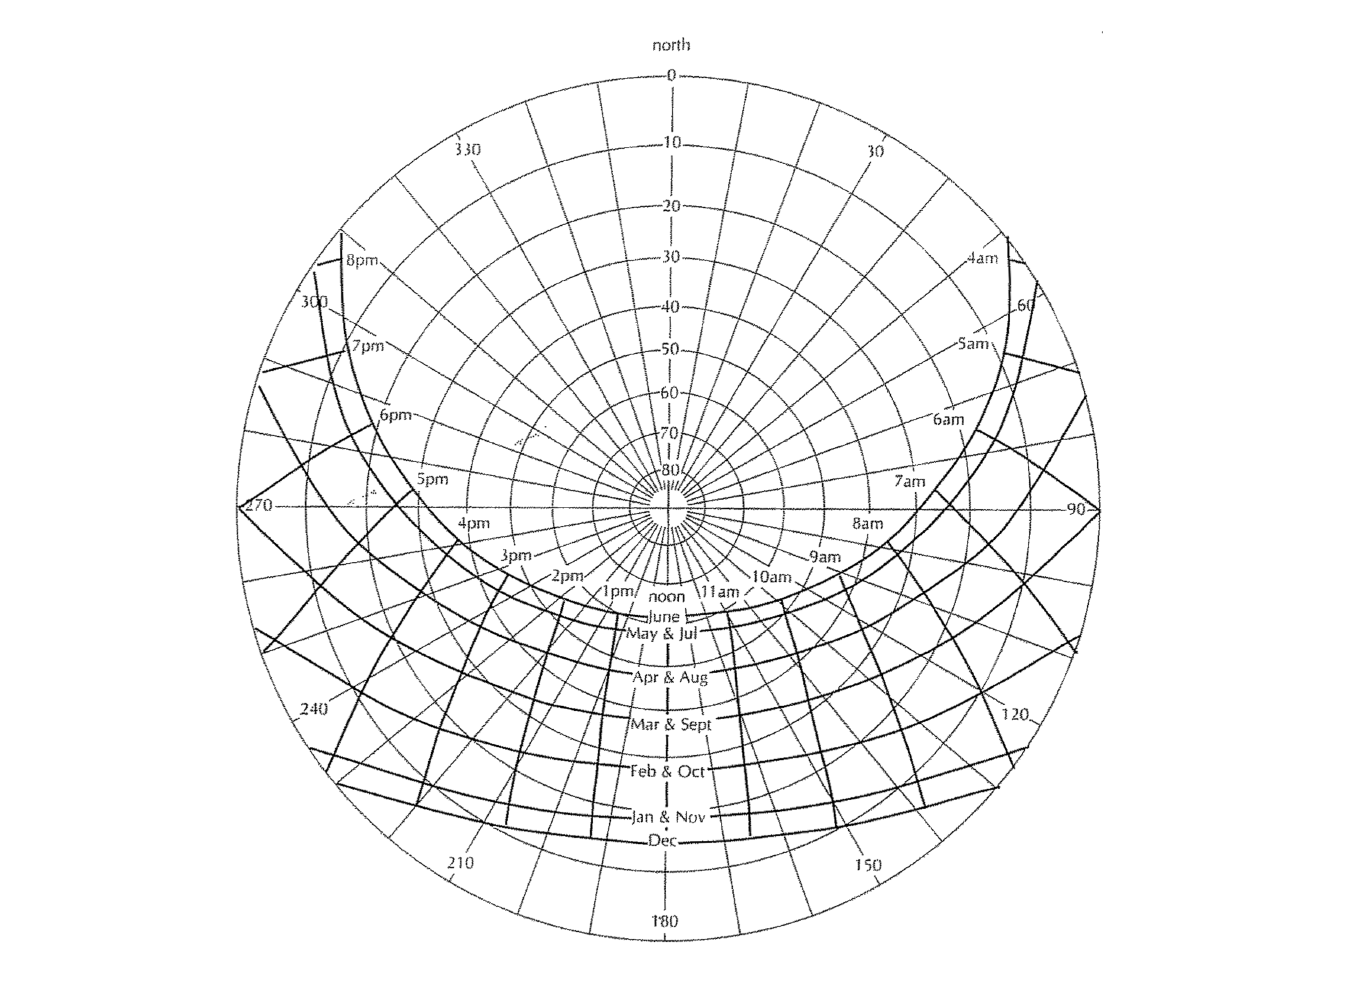
This Stereographic Sunpath contains information about the month, the hour, the latitude of the target location, the simulated movement of the sun, and the resulting projection changes. Knowing two of the five factors leads to the remaining three.
Conclusion
This one zooms in on a global scale, while the previous one pinpoints the sundial at specific latitudes. The information obtained by this icon is broader and richer, which can help me understand the variation and connection between the sun’s trajectory and solar projections at different latitudes in a broad sense. The former image is more specific and precise, targeting more precise locations and producing more useful data.


Leave a Reply