
[Week 7]Exploration on carbon cycle
After the given lecture, in this blog, I’d like to explore the carbon cycle, which contains net carbon emission(the emphasized one), carbon emission per people and carbon track. Cuz it could be so crucial for us to know the history of carbon and how history materialism function in this process. Meanwhile, I’d like to share some individual experience about vital materialism in the next blog. I will try to simplify this article hhh.
- Net carbon emission
In general, what we said zero net emission is to reach the equation between the elimination amount of CO2 and the emission amount of CO2 rather than we just make the prohibition on emission. There are lots of methods to reach this target like tree planting(afforestation), carbon capture and emissions trade. The formation of emissions trade launched by the Kyoto Protocol is so interesting cuz it takes the reduction of carbon into an economic measure. Meanwhile, it created a market for developed and developing countries. In my opinion, it could be seen as some countries restrict other countries’ right to development through environmental protection.
Zero net emission should be involved in the recycling economy. Actually, chemical engineering could calculate every material flow, energy flow and waste emission at the very initial/crucial preliminary processing design. Industrial production contains at least three stages-resources, processing, usage. Just think about one thing. If we put the manufacture and waste disposal aboard while adopting clean resources as main energy, then we get much less amount of domestic emission theoretically(in fact, some countries has done before ) What a self-deception way!
Some images:
Carbon transfer
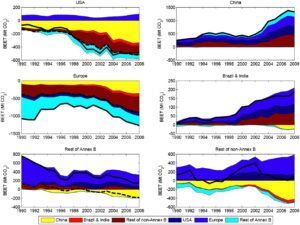
The development of the net emission transfer via international trade between Annex B and non-Annex B countries for six aggregated regions from 1990 to 2008 using the TSTRD method. Net emission transfers represent the emissions from the production of exports (SI Appendix, Fig. S4) minus the emissions in other countries from the production of imports (SI Appendix, Fig. S5). The colored areas are the emission transfers for each region, the solid black line is the net emission transfers for each region with the rest of the world, and the dashed black line is the net emission transfers for the Annex B with non-Annex B countries (comparable with Fig. 2).
Reference link:
https://www.pnas.org/content/108/21/8903.full
https://www.pnas.org/content/107/12/5687.abstract


Recent comments