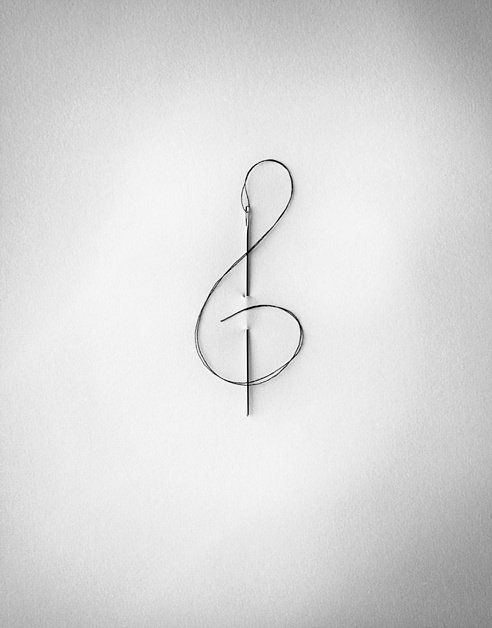
 Photograph by Chema Madoz.
2020… What a year. The whole world is fighting something that nobody yet knows how to beat. The year of the closed spaces, lesser friends, challenges of mental and physical health.
“Have to stay sane…” we hear all over. The most efficient ways seem to be spamming social media platforms with photographs of baked goods or being open about regular wine tasting, obsessing with video challenges or online shopping.
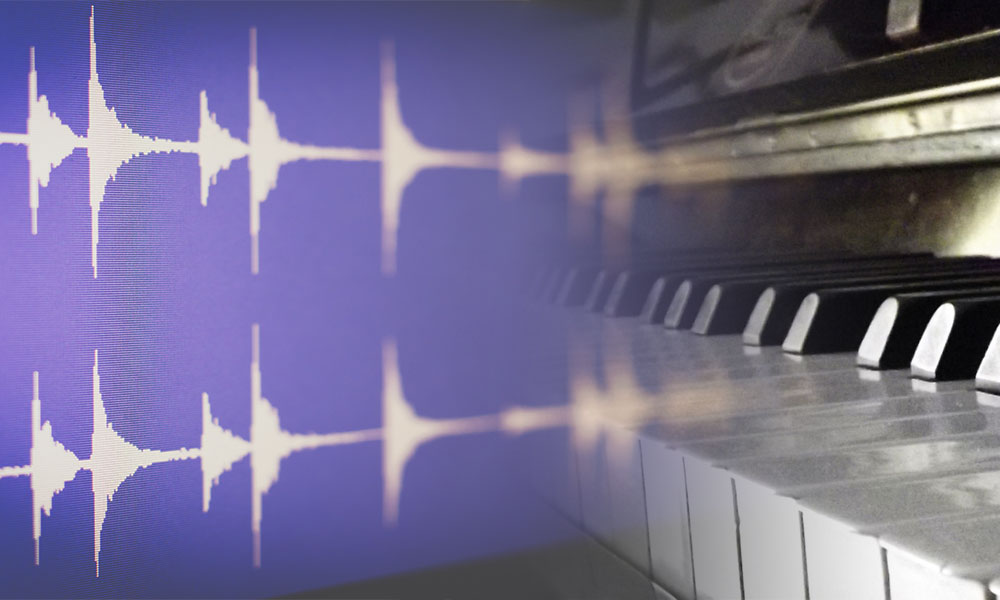
Yet I stayed on my feet immersing into music. I have been a professional piano player while growing up. Music is a huge part of my life, but yet I haven’t touched a piano for years.
To cut short – I reconnected with my long lost love. Piano ended up being my best and most reliable friend during these fragile and uncertain times.
Music is well known for its healing properties. It can provide forms of feelings and emotions, stabilise them. Transform state of mind.
Music causes so many brain functions and then unifies them. Almost every part of the brain is involved. Music is proven to do so more than language, as mentions British neurologist, Oliver Wolf Sacks.
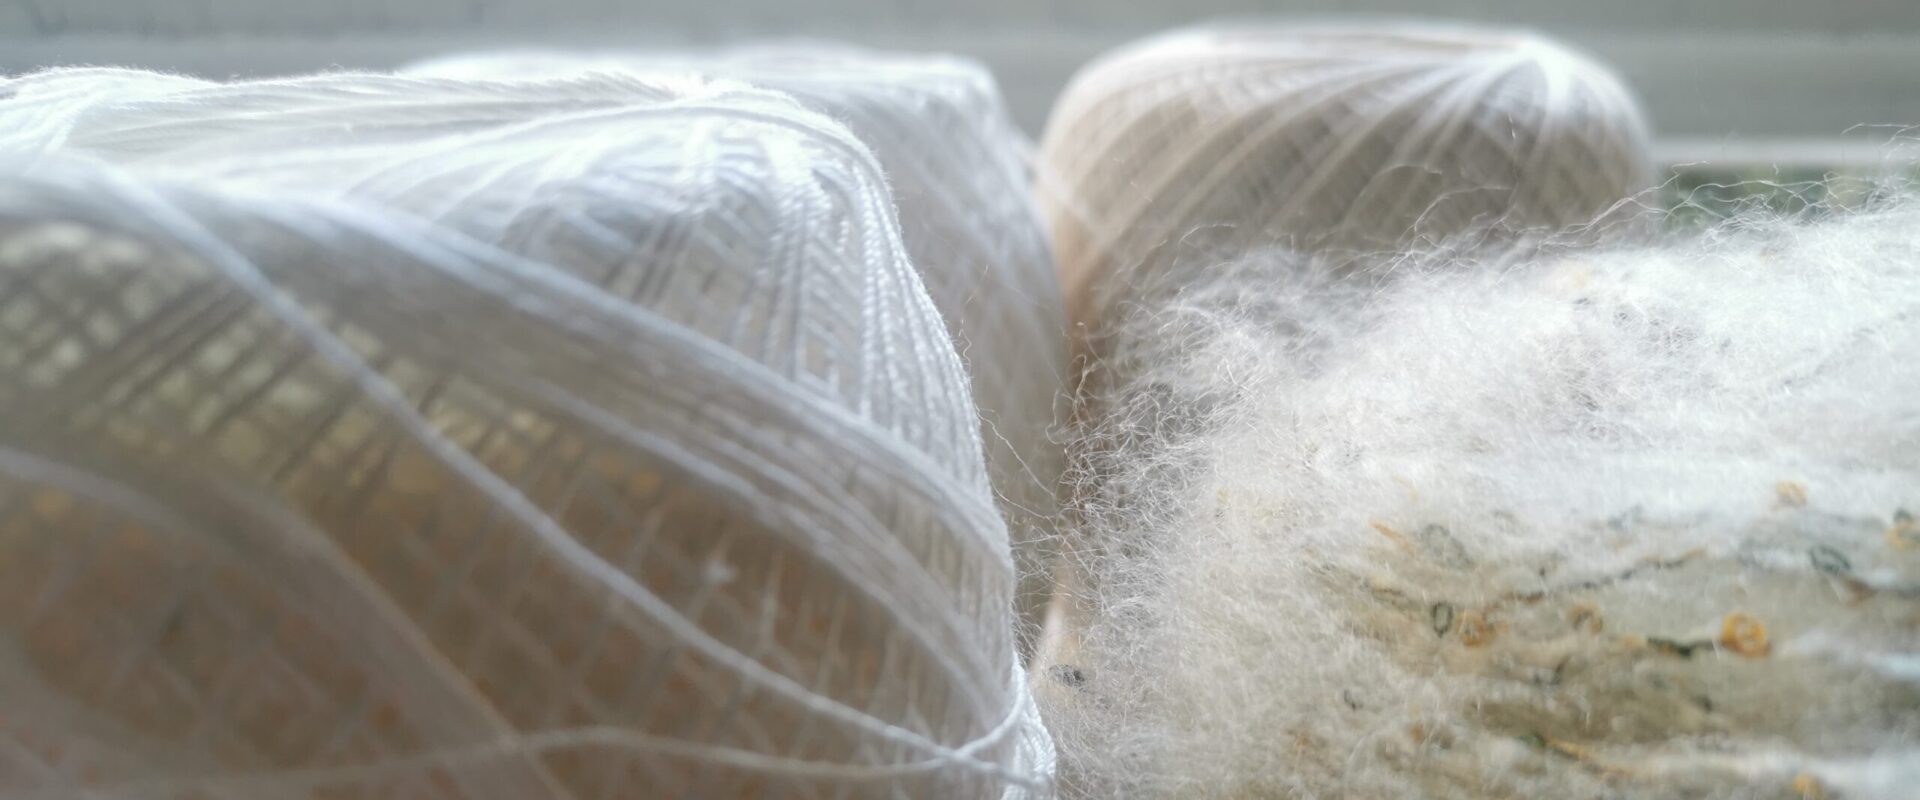
I began to wonder if I could merge two of my passions – textiles and music – together and how.
Researching on the topic I discovered a short documentary called When Björk Met Attenborough.
I was truly inspired by the aim to visualise sound and music. All kind of ideas were coming to my head. And the loudest of all was the question – Why don’t I try to translate sound onto textiles?
At the end sound and music are patterns, all based in mathematics and data – it is a huge network of information.
Knowing the power of music I began to wonder how could I bring music closer to people.
My research led me to pentatonic scale. Which is known as naturally understandable in humans’ brain. I came across this video:
In this live demonstration, musician Bobby McFerrin uses audience participation to show that, when given two notes, the other notes of the pentatonic scale can be easily obtained. It seems that everyone automatically understands this scale, regardless of where, when and what qualifications they have, from a musical genius to a child, this is a natural phenomenon.
That was my starting point!
I also asked people to choose notes from the pentatonic scale. But this time, the notes were coded with letters, therefore intuition played even bigger part . Since those six notes together are so natural to human ear, I figured that no combination will be sounding bad.
My idea is to compose music without people even realising that they are participating and “write it down” on the fabric. This way I will make the sound visible or even wearable.
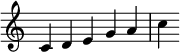
In music, every sound in the scale is assigned with a letter. Pentatonic scale consists of C D E G A C notes, that written on a stave look like that:
I began to gather information from people, asking them to shuffle the given letters and provide me with a random combinations of six symbols (letters). I started to see pattern emerging, networks forming when over laying the results on top of the other.
I chose to examine people from different backgrounds, different age. Starting with my youngest cousin and finishing with my granny.
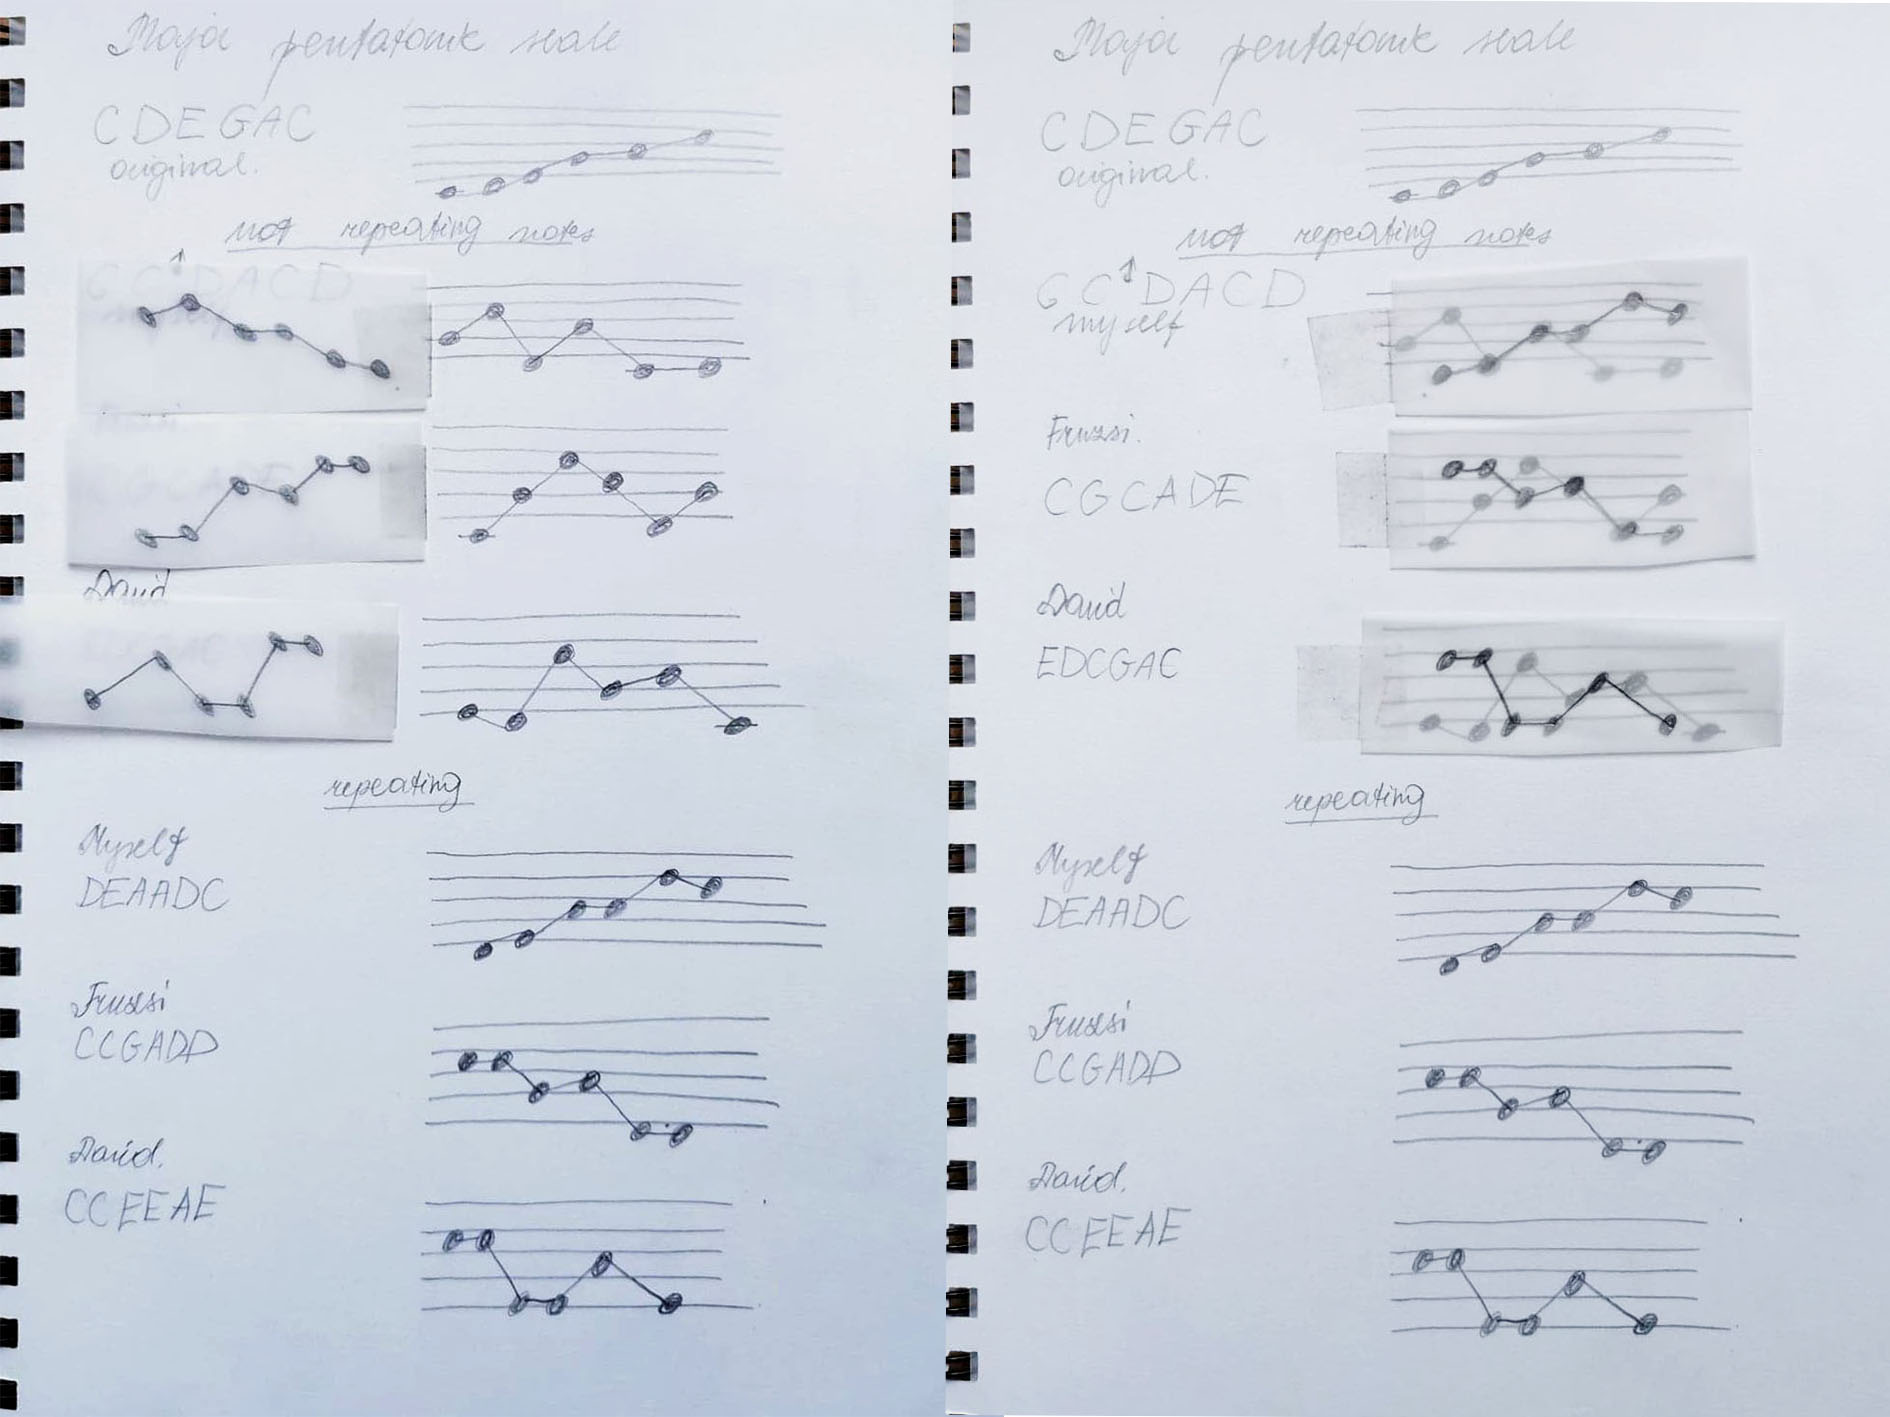 First three results. I asked for more than one combination from the same person and started to overlap them, to see emerging patterns.
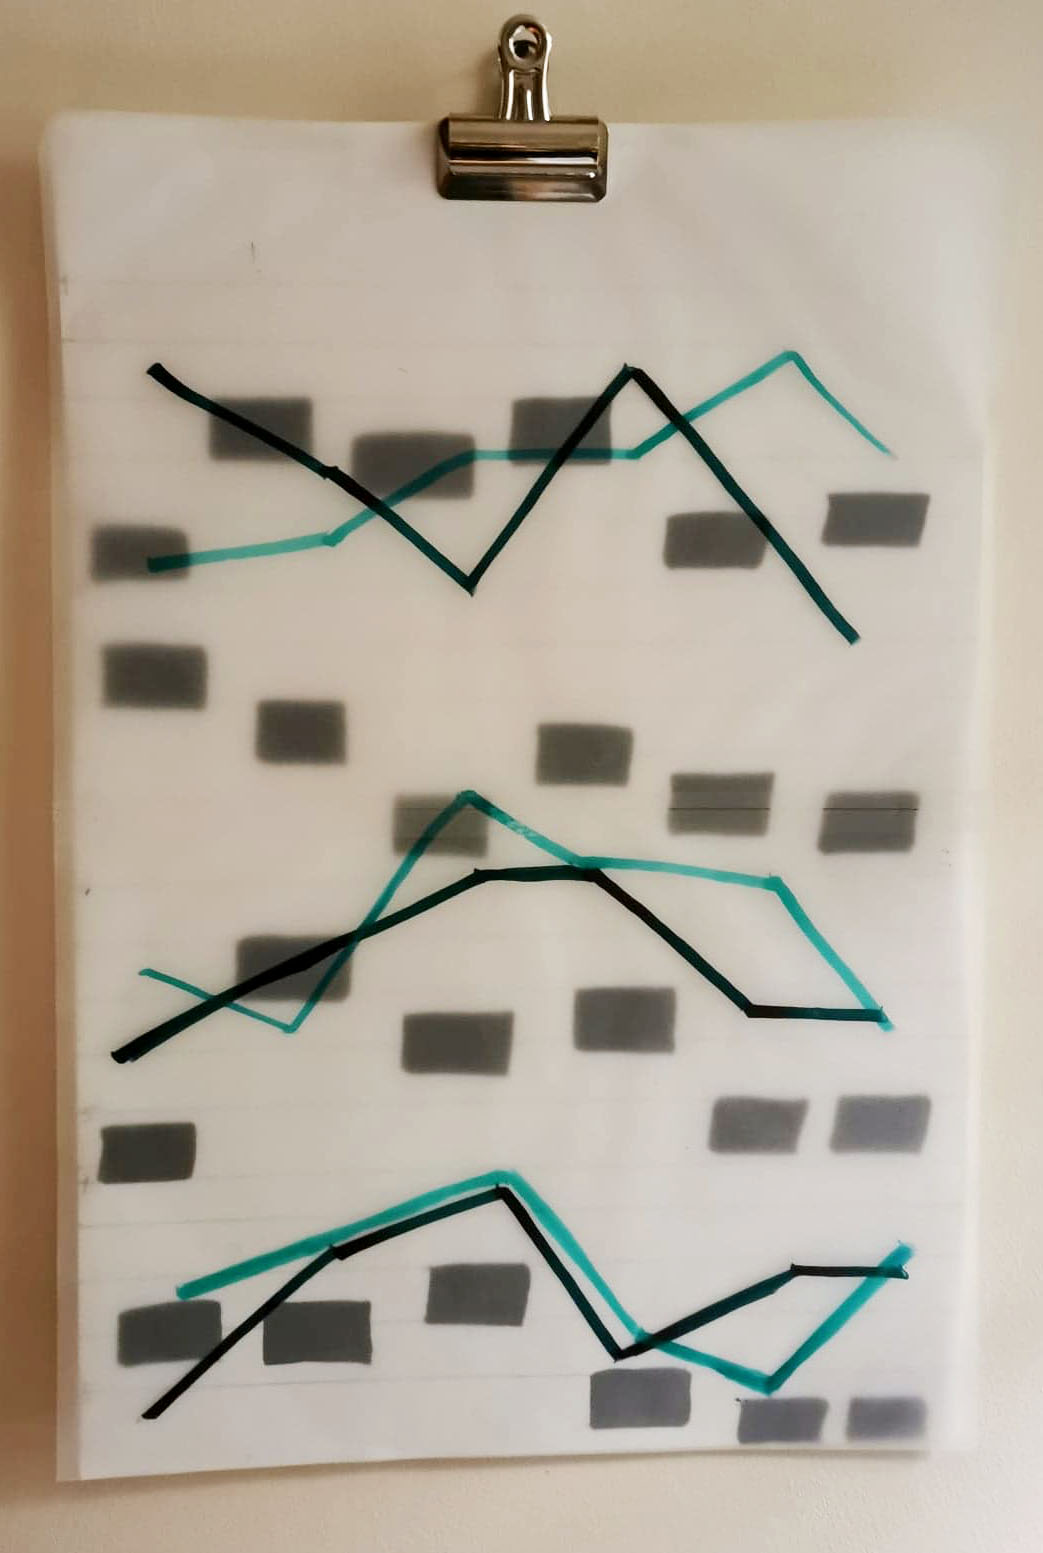
Translated the letters into notes and wrote them down on the staves.
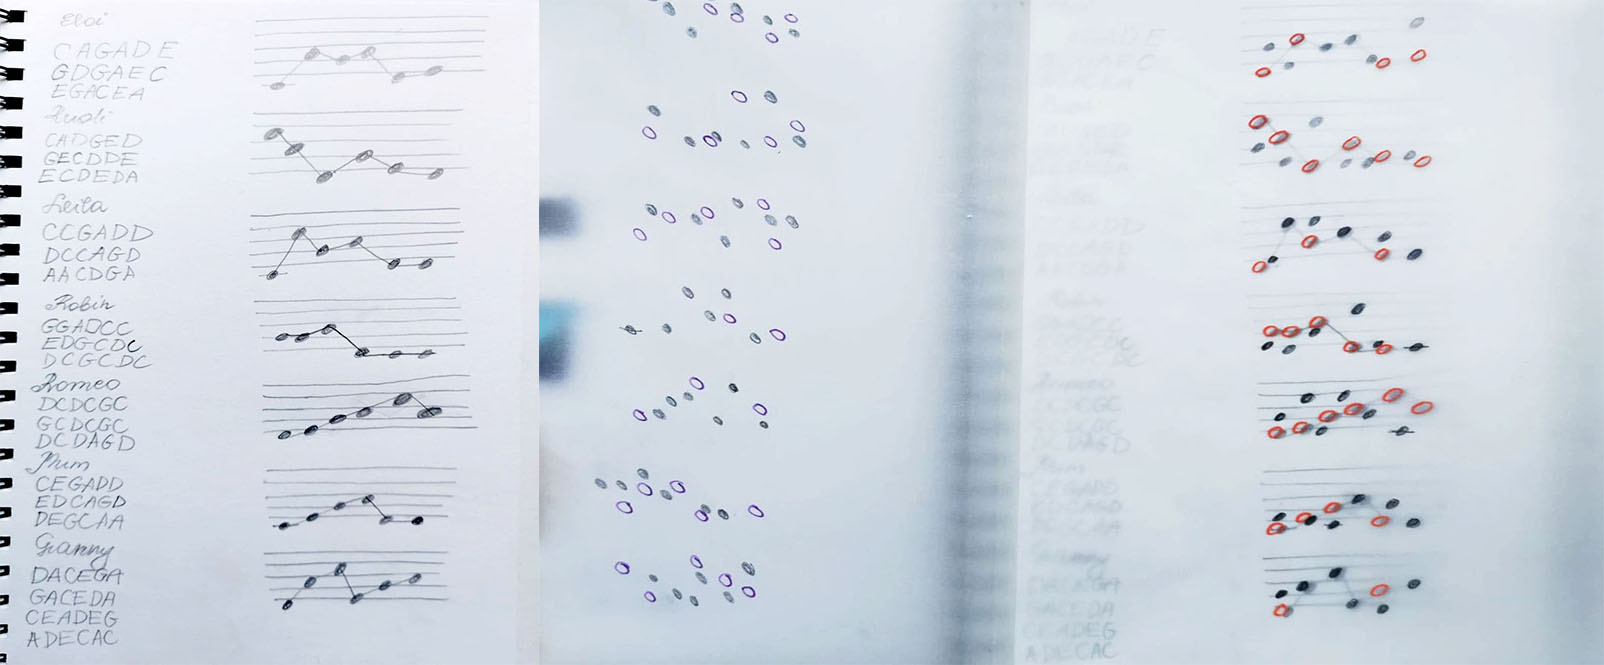 Bigger group of people. I kept overlaying the combinations of notes on top of each other using tracing paper. There was not much noticeable similarities in peoples choices. Regardless, even combining totally random sequences started to give me some patterns to work with.
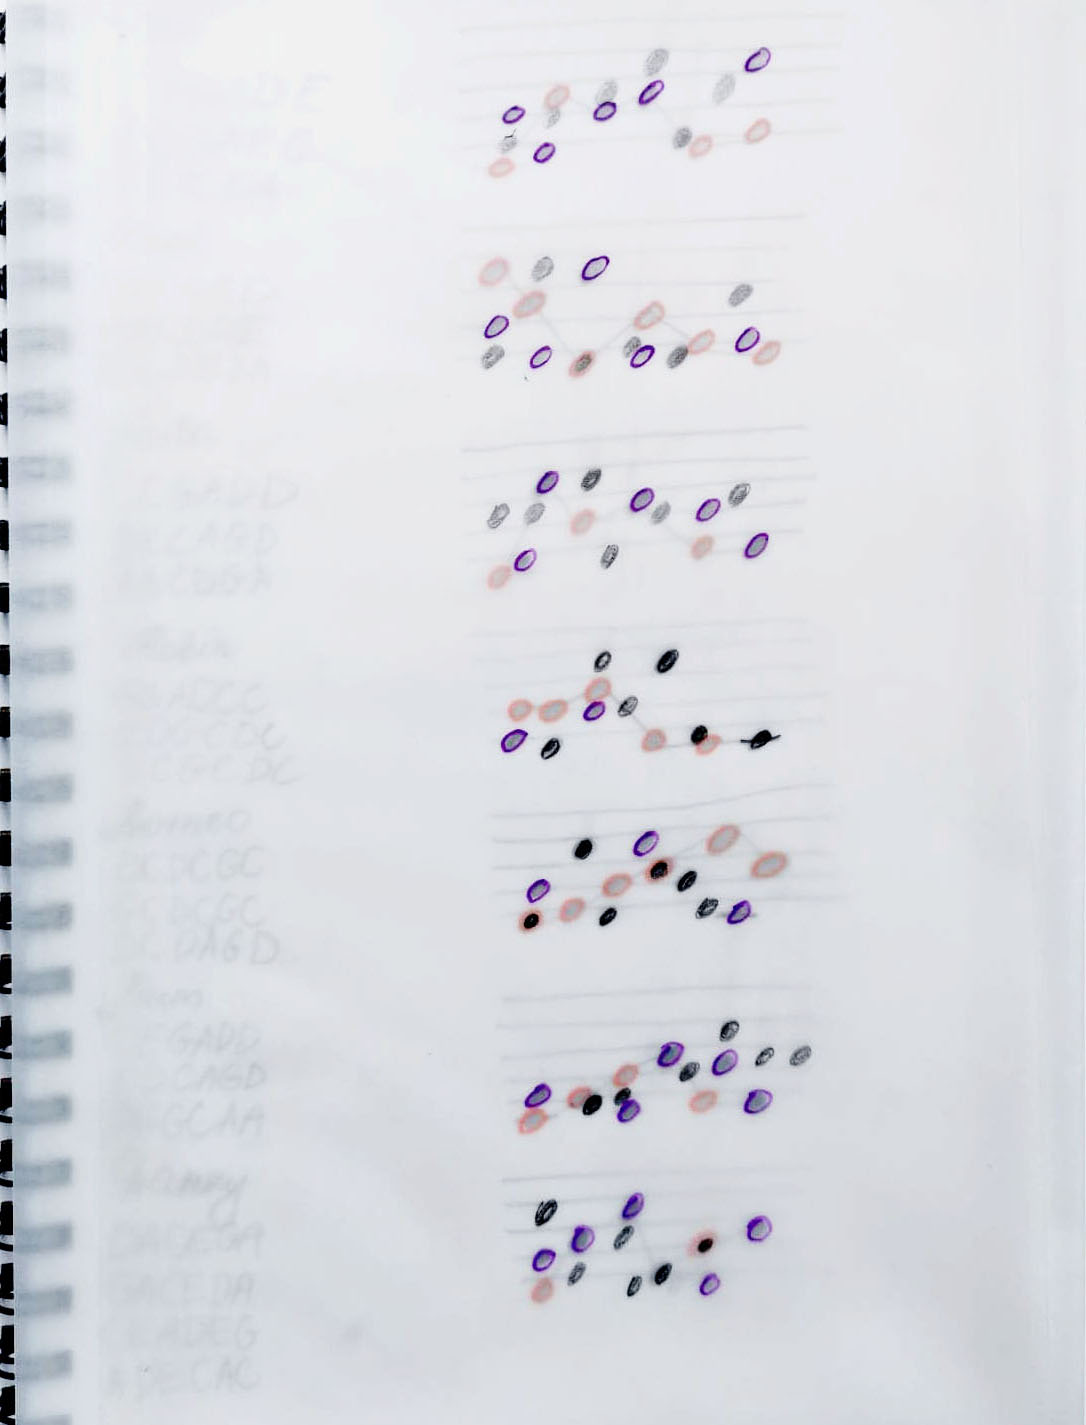
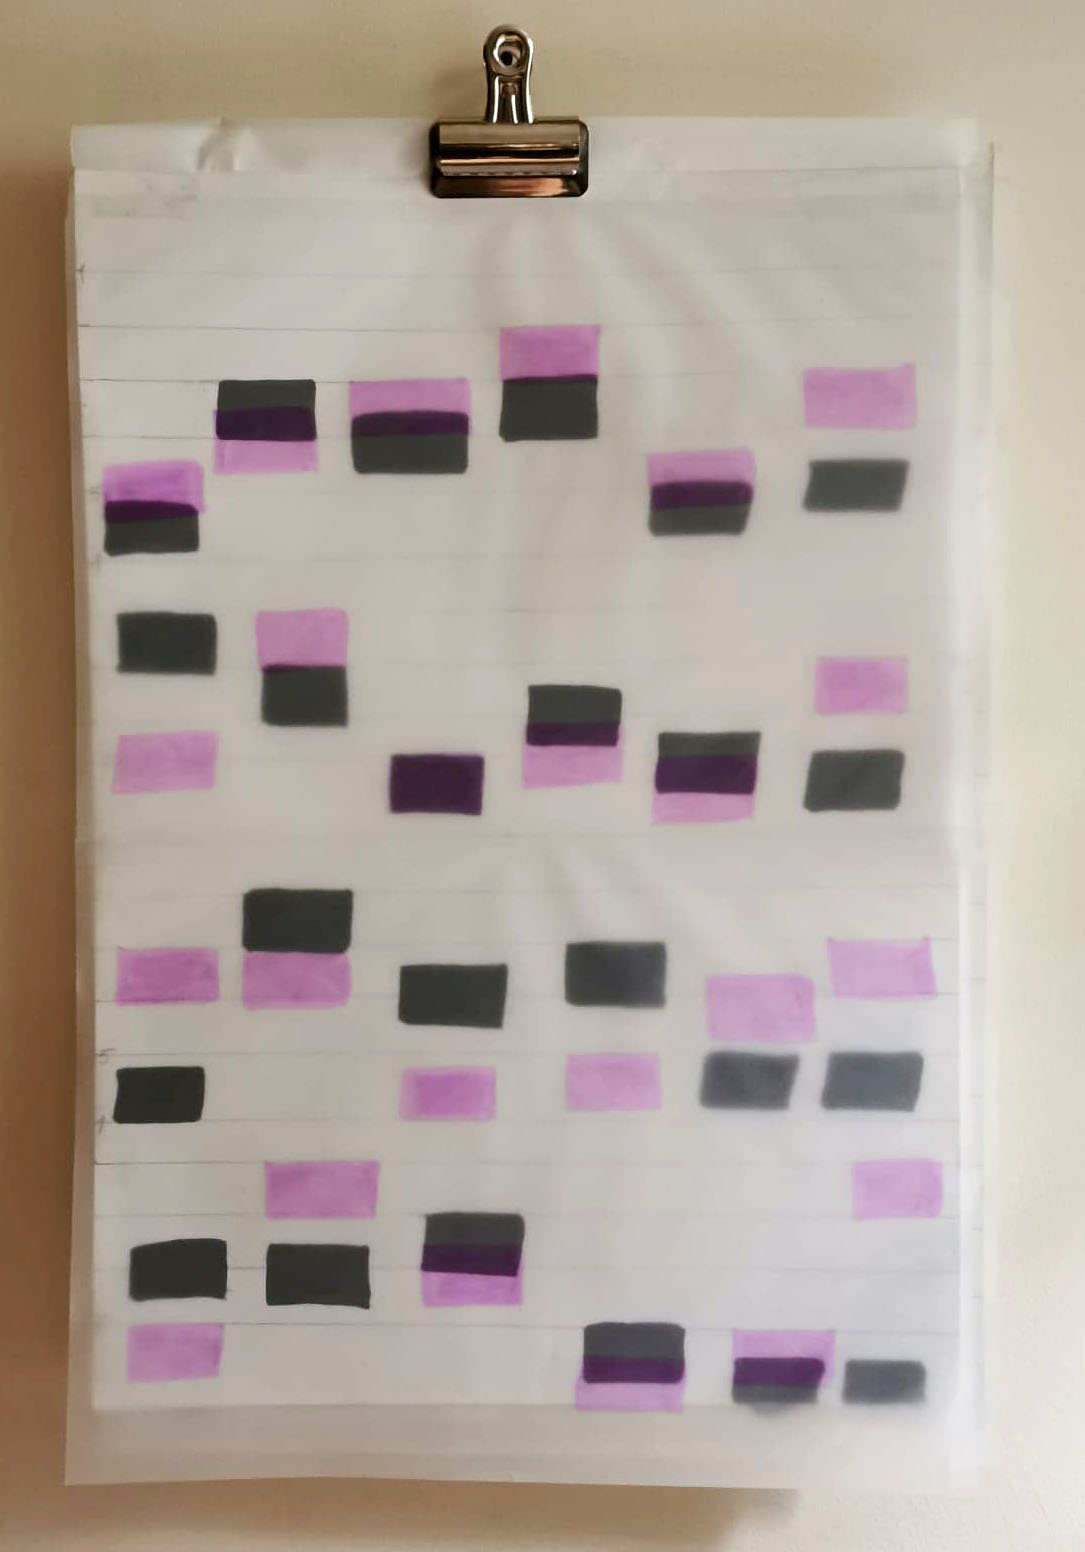
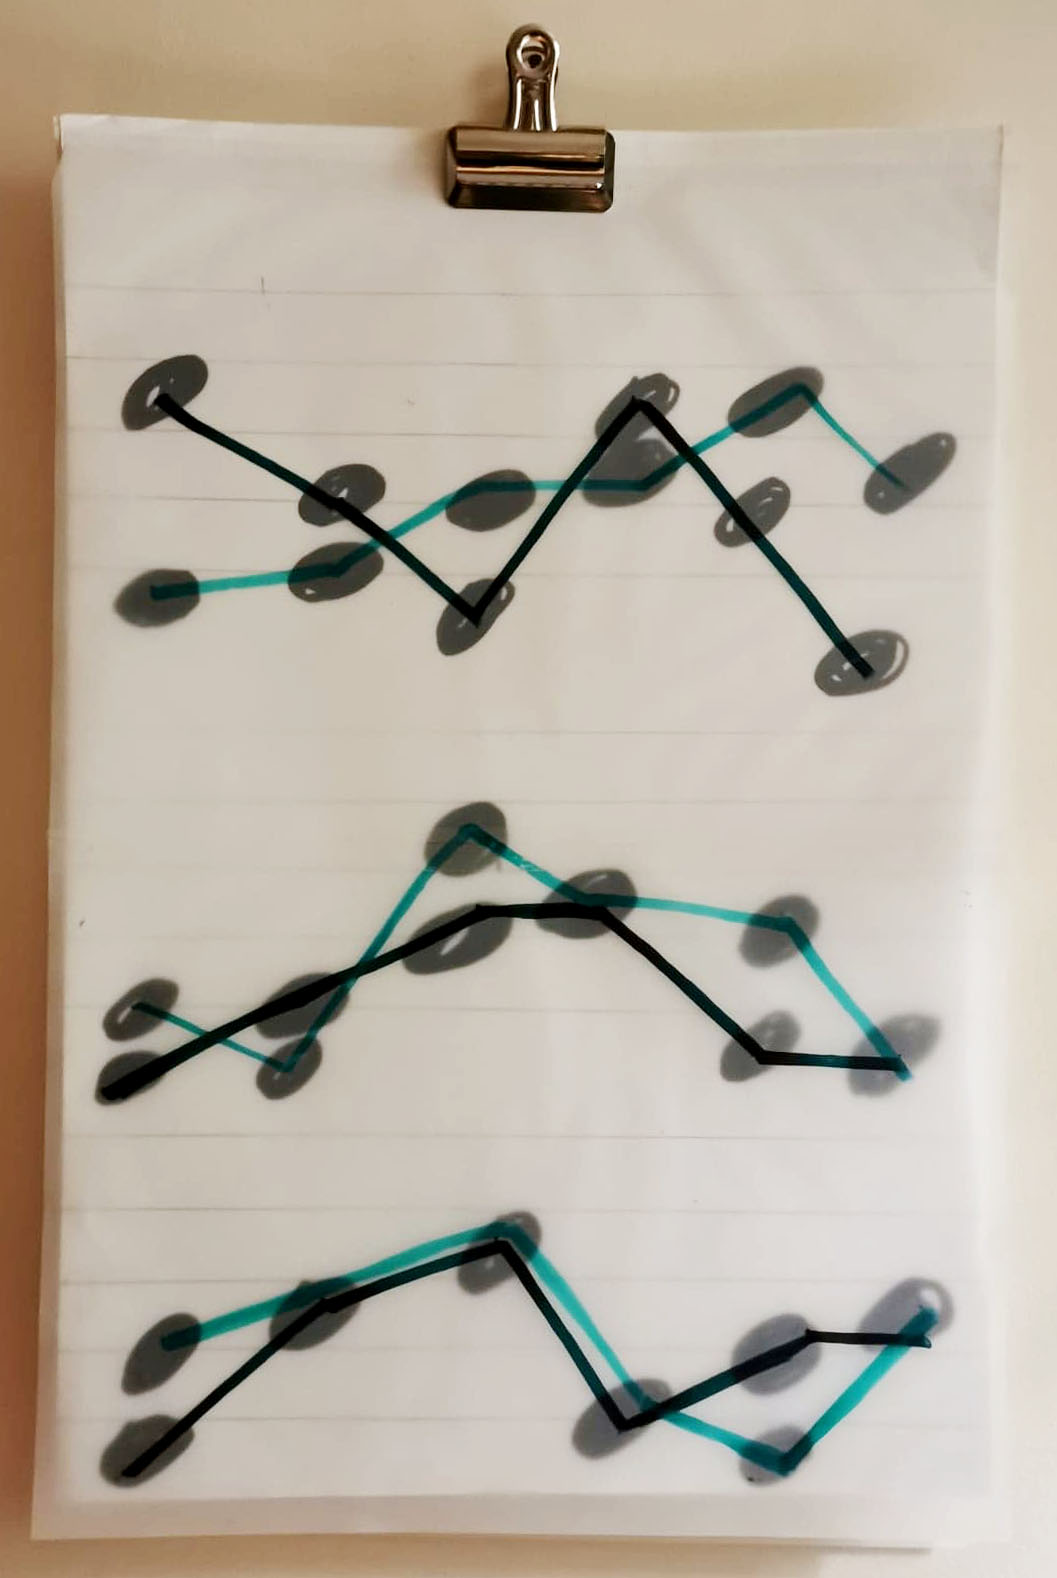
I coded different answers with different colours here to see the patterns more clear.
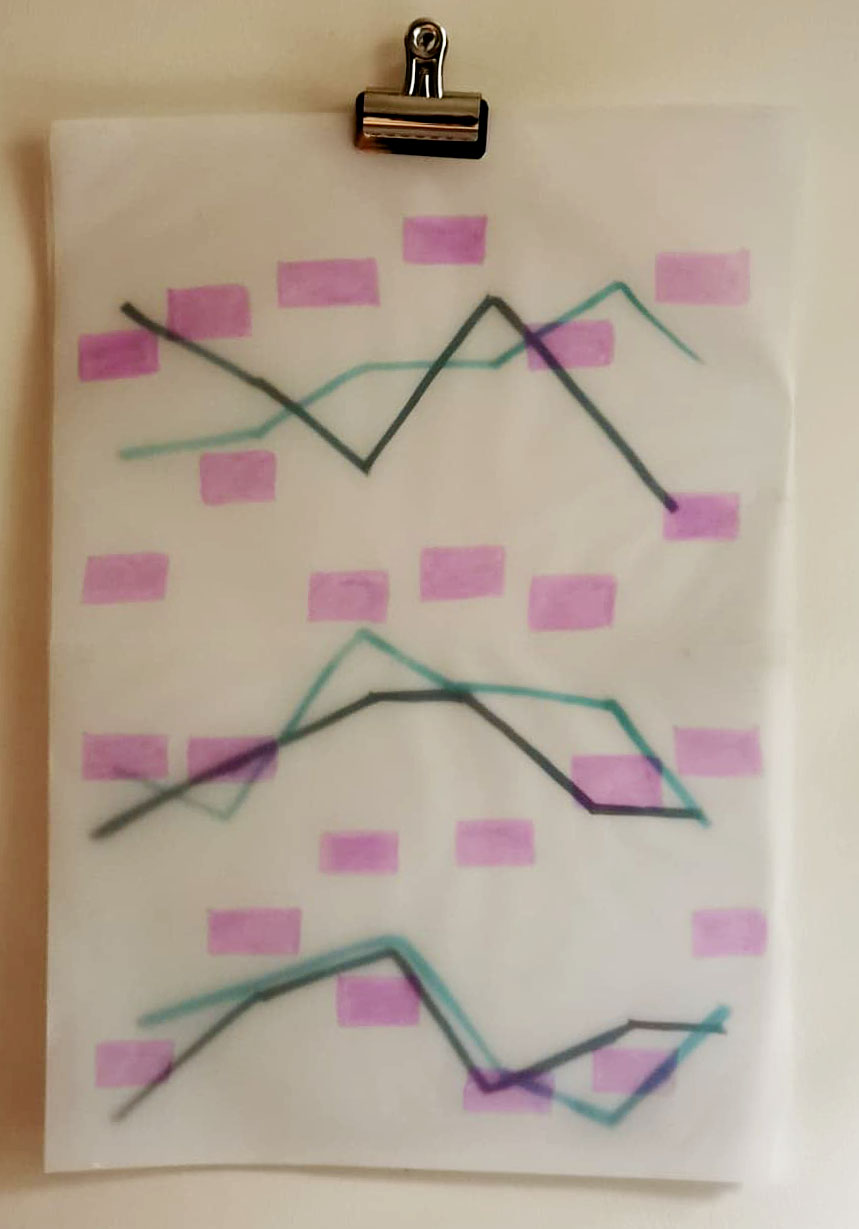
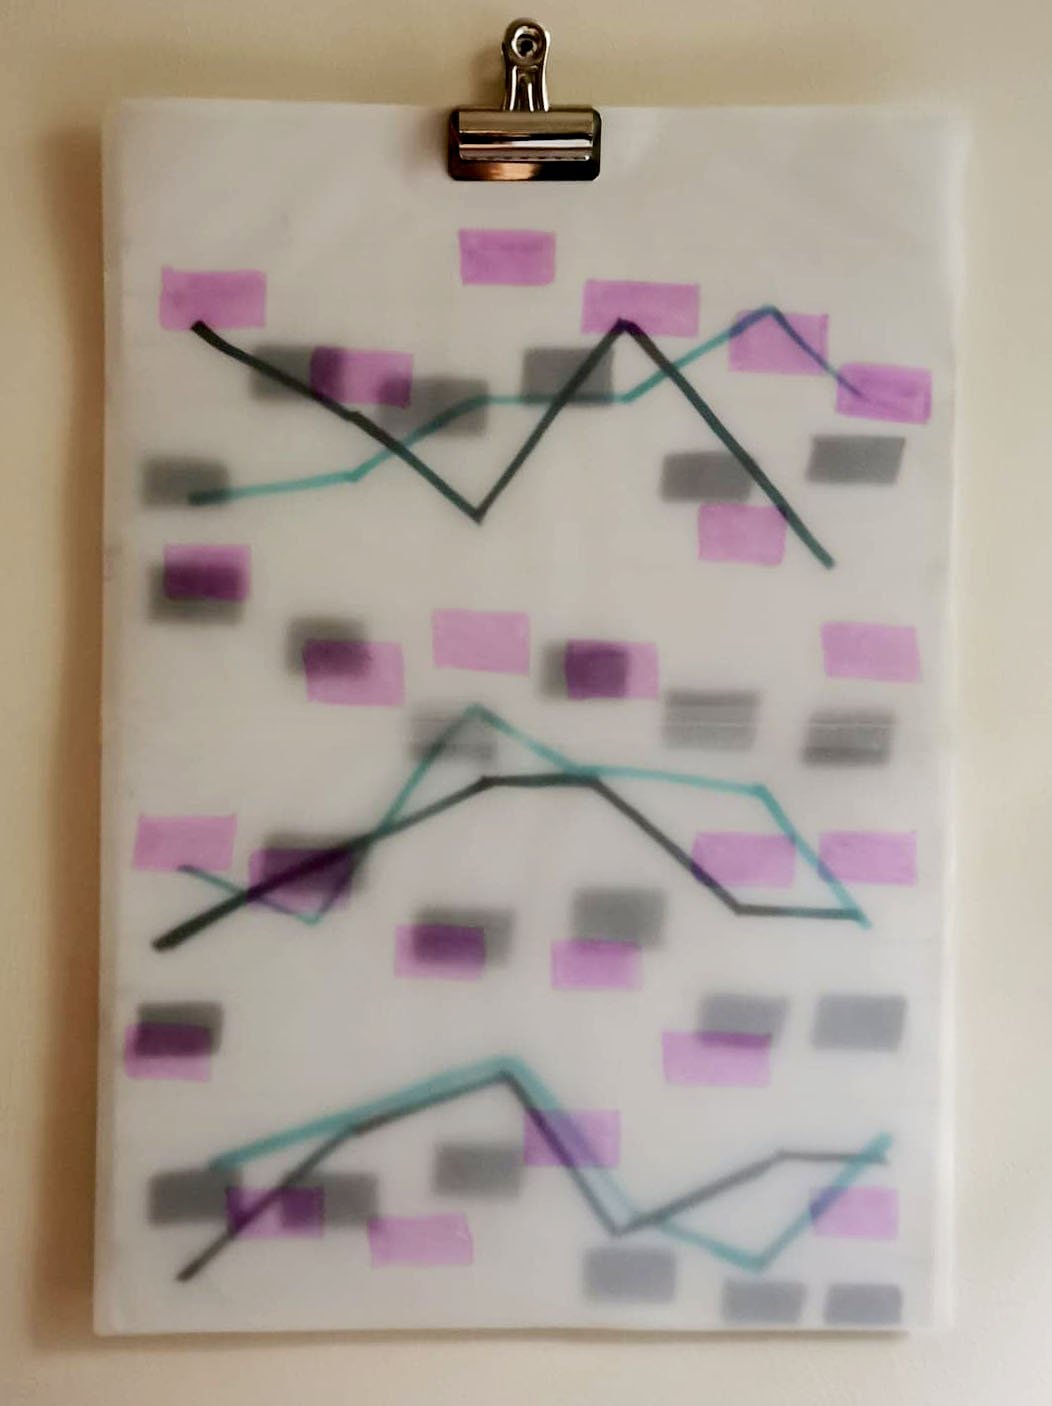
I experimented with scale. These are A2 sheets of cartridge and tracing paper. I represented my gathered data on these and hung them on the wall, to see better perspective. Then played with the position and layering.
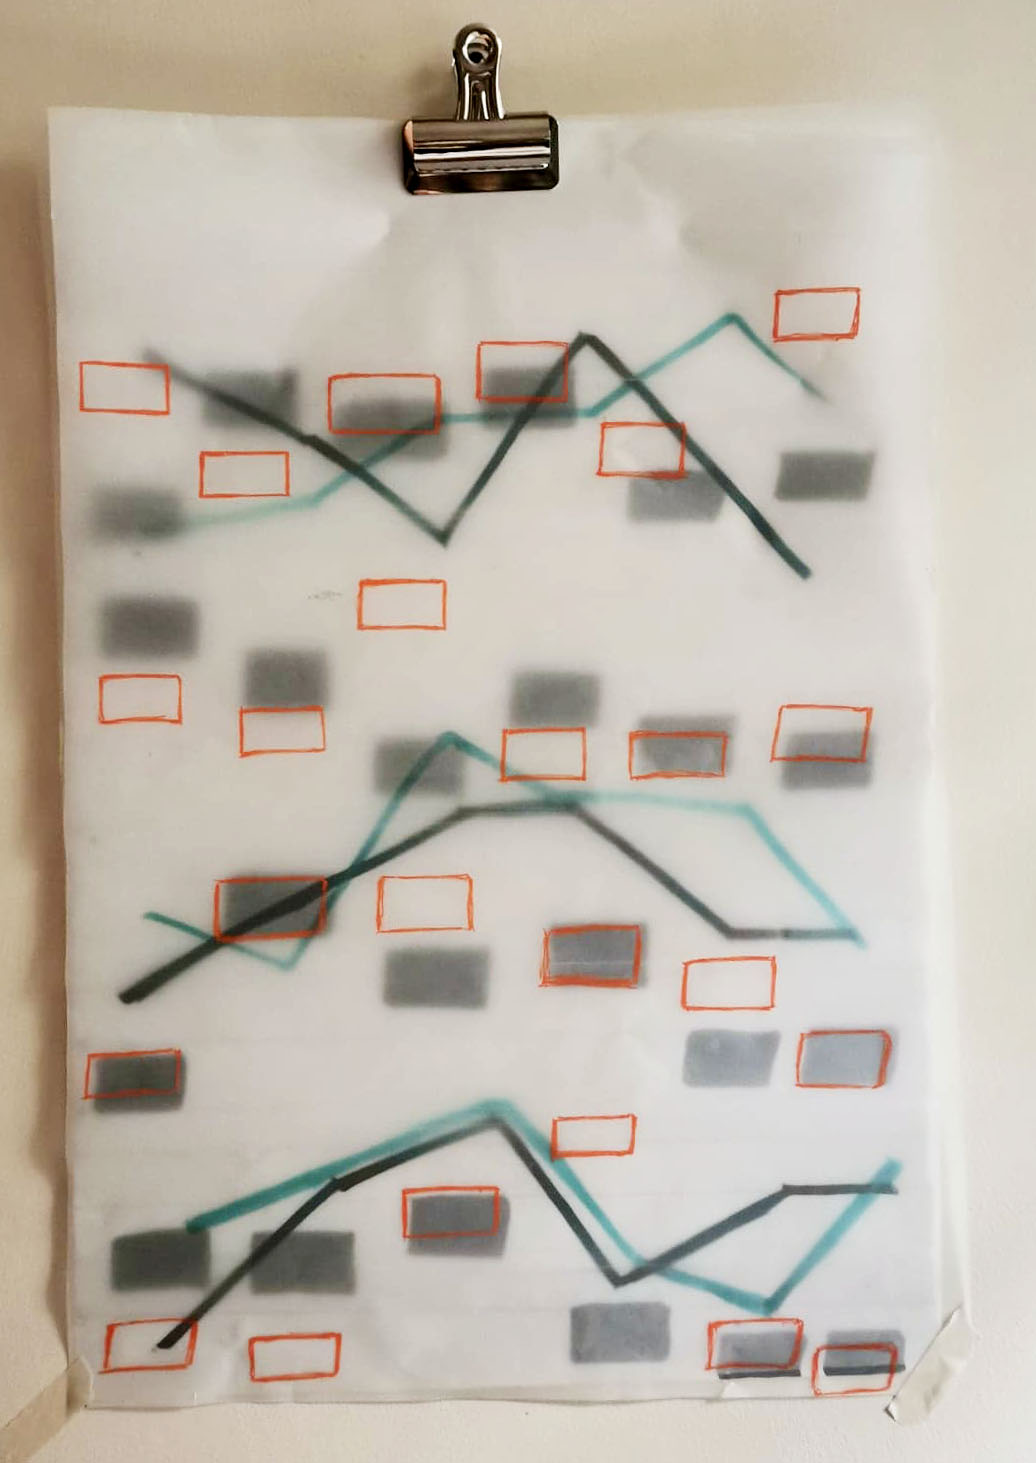
A little more intricate ones. There are no limits here!
I was doubting if my idea will be correct and will give me enough information.
At the end I collected a lot of data and got some material to work with. I am now ready to look into the fabrics and the techniques I’ll be using. Keep your eyes open for my next post.
Coming soon!


nicely composed post which lays out your theme really clearly. It is so good to see the development of your sketches. The video links are really useful to explain your concept.