Moving forward from my research, I want to see what kind of advertising categories my peers were getting from the social media platforms they were using, and comparing them to how they perceive themselves and their interests.
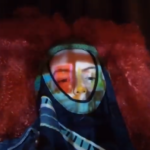
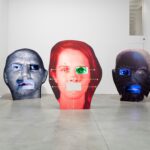
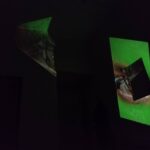
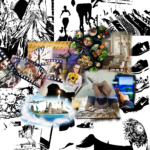
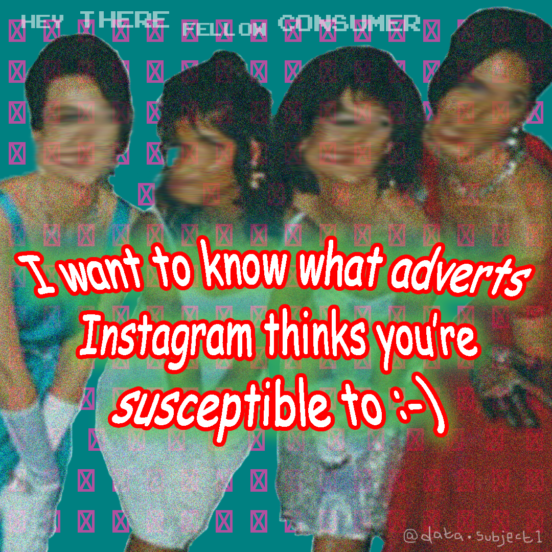
I made a call out for people to send me 10 topics they personally found interesting, and a screenshot of their top Instagram Ads Interests. To present this work, I set up the account data.subject1 (Data Subject being the industry term to refer to the entity for which a set of data relates to). Here are some examples of what was produced:
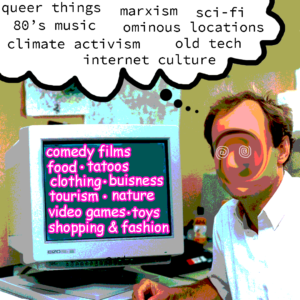
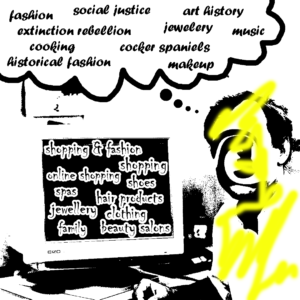
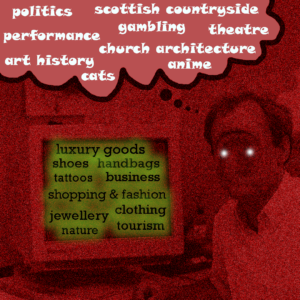
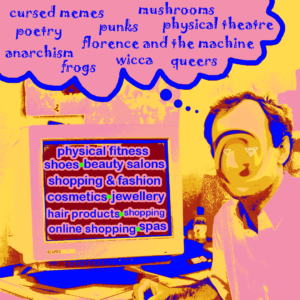
The information is presented though these repeating graphics, which feature a warped photo of Time Berners-Lee, the creator of the internet, posing next to a computer. Since my work is focused on the online world, I though it would make sense to connect my work back to its origins, and one could see this as a comment on the once optimistic view the public had of the web. I had tried some simpler designs for the graphics, using just colour and text, but I felt this design best conveyed the meaning and looked visually appealing.
Following on from this, I’d like to analyse which categories generated by Instagram were the most popular, and see if there are any connections I can make between the personal interests and the ads interests. I’d also like to do a few more surveys to get a deeper understanding of this – for example I’d like to know how many people actually engage with / click on social media adverts.
In future, I could try finding a way in which I can spread this information and artwork in a public space, through the use of flyposters for example.