
Week 8 – Representing Data through Different Mediums
This week shone a spotlight on the course: Representing Data. This was due to our imminent group project which had more-or-less already secured its final form and was now being finalised. Although I have worked on a variety of group projects before, 8 in total across both semesters, this course’s group project has proven itself to be the most challenging and stimulating. I will break down an analysis of our process in this blog post.
Challenge 1: Building a bridge between interdisciplinary teammates. Right off the bat, the group I’m in was structured from a combination of choice and appointment. Two of our teammates were assigned by our course convenor, whereas one is a friend I’d voluntarily chosen. Additionally, both assigned teammates proved difficult to contact for the first 2-3 weeks, which left less time for initial ice-breakers and team-building. Furthermore, the one assigned teammate that ended up staying (the other revealed they’d dropped out and was no longer interested in continuing with the course) is from a radically different discipline to ours (computer science vs English literature and business).
Outcome: We scheduled weekly meetings on Wednesday at 2pm to ensure we were always touching base. Although there were points when we were disgruntled with each other or weren’t seeing eye-to-eye, our fixed schedule meant we always were on track to produce something, and that we were meeting and communicating regardless. This also helped with smoothing out issues between disagreeing team members, which the third teammate would usually assist with. In the end, we were able to not only focus on our areas of expertise, but to learn from one another and to assist each other in the production of their work for the portfolio (thus learning from their skills in turn).
Challenge 2: Our raw data contained incorrect numbers. We are looking at scholarship scholars from the continent of Africa currently studying at EFI, which we’ve divided into four categories of analysis: female, non-female, disabled, displaced. There is overlap between the categories as a scholar could identify whichever categories they identified with. However, whilst processing the data, we realised that the Excel sheet had mistakenly inserted a ‘non-female’ for each ‘female’ shown in the data. This meant that our data had been skewed and would need to be readdressed – taking additional time and effort.
Outcome: We met as a group and sifted through each of our data representations to ensure that a) the data was correct (the error was corrected and a ‘non-female’ was removed for every ‘female’ shown for a particular country) and b) that each of our data representations reflected this change in our data. Although challenging, it taught us to be thorough with data in general, and to ensure that we were going back to the raw data each time to ensure our data set was being accurately reflected.
Challenge 3: Choosing different mediums of data representation proved a challenge as we could not agree on one or two data representations. Our teammate from computer science wanted to do a python visualisation, whereas our business teammate wanted to use Tableau to process the data. Personally, as an artistic individual, my preference leaned heavily towards data physicalisation. Thus, it didn’t feel right to choose one or the other as it would result in a strong imbalance between team members our’ abilities and interest.
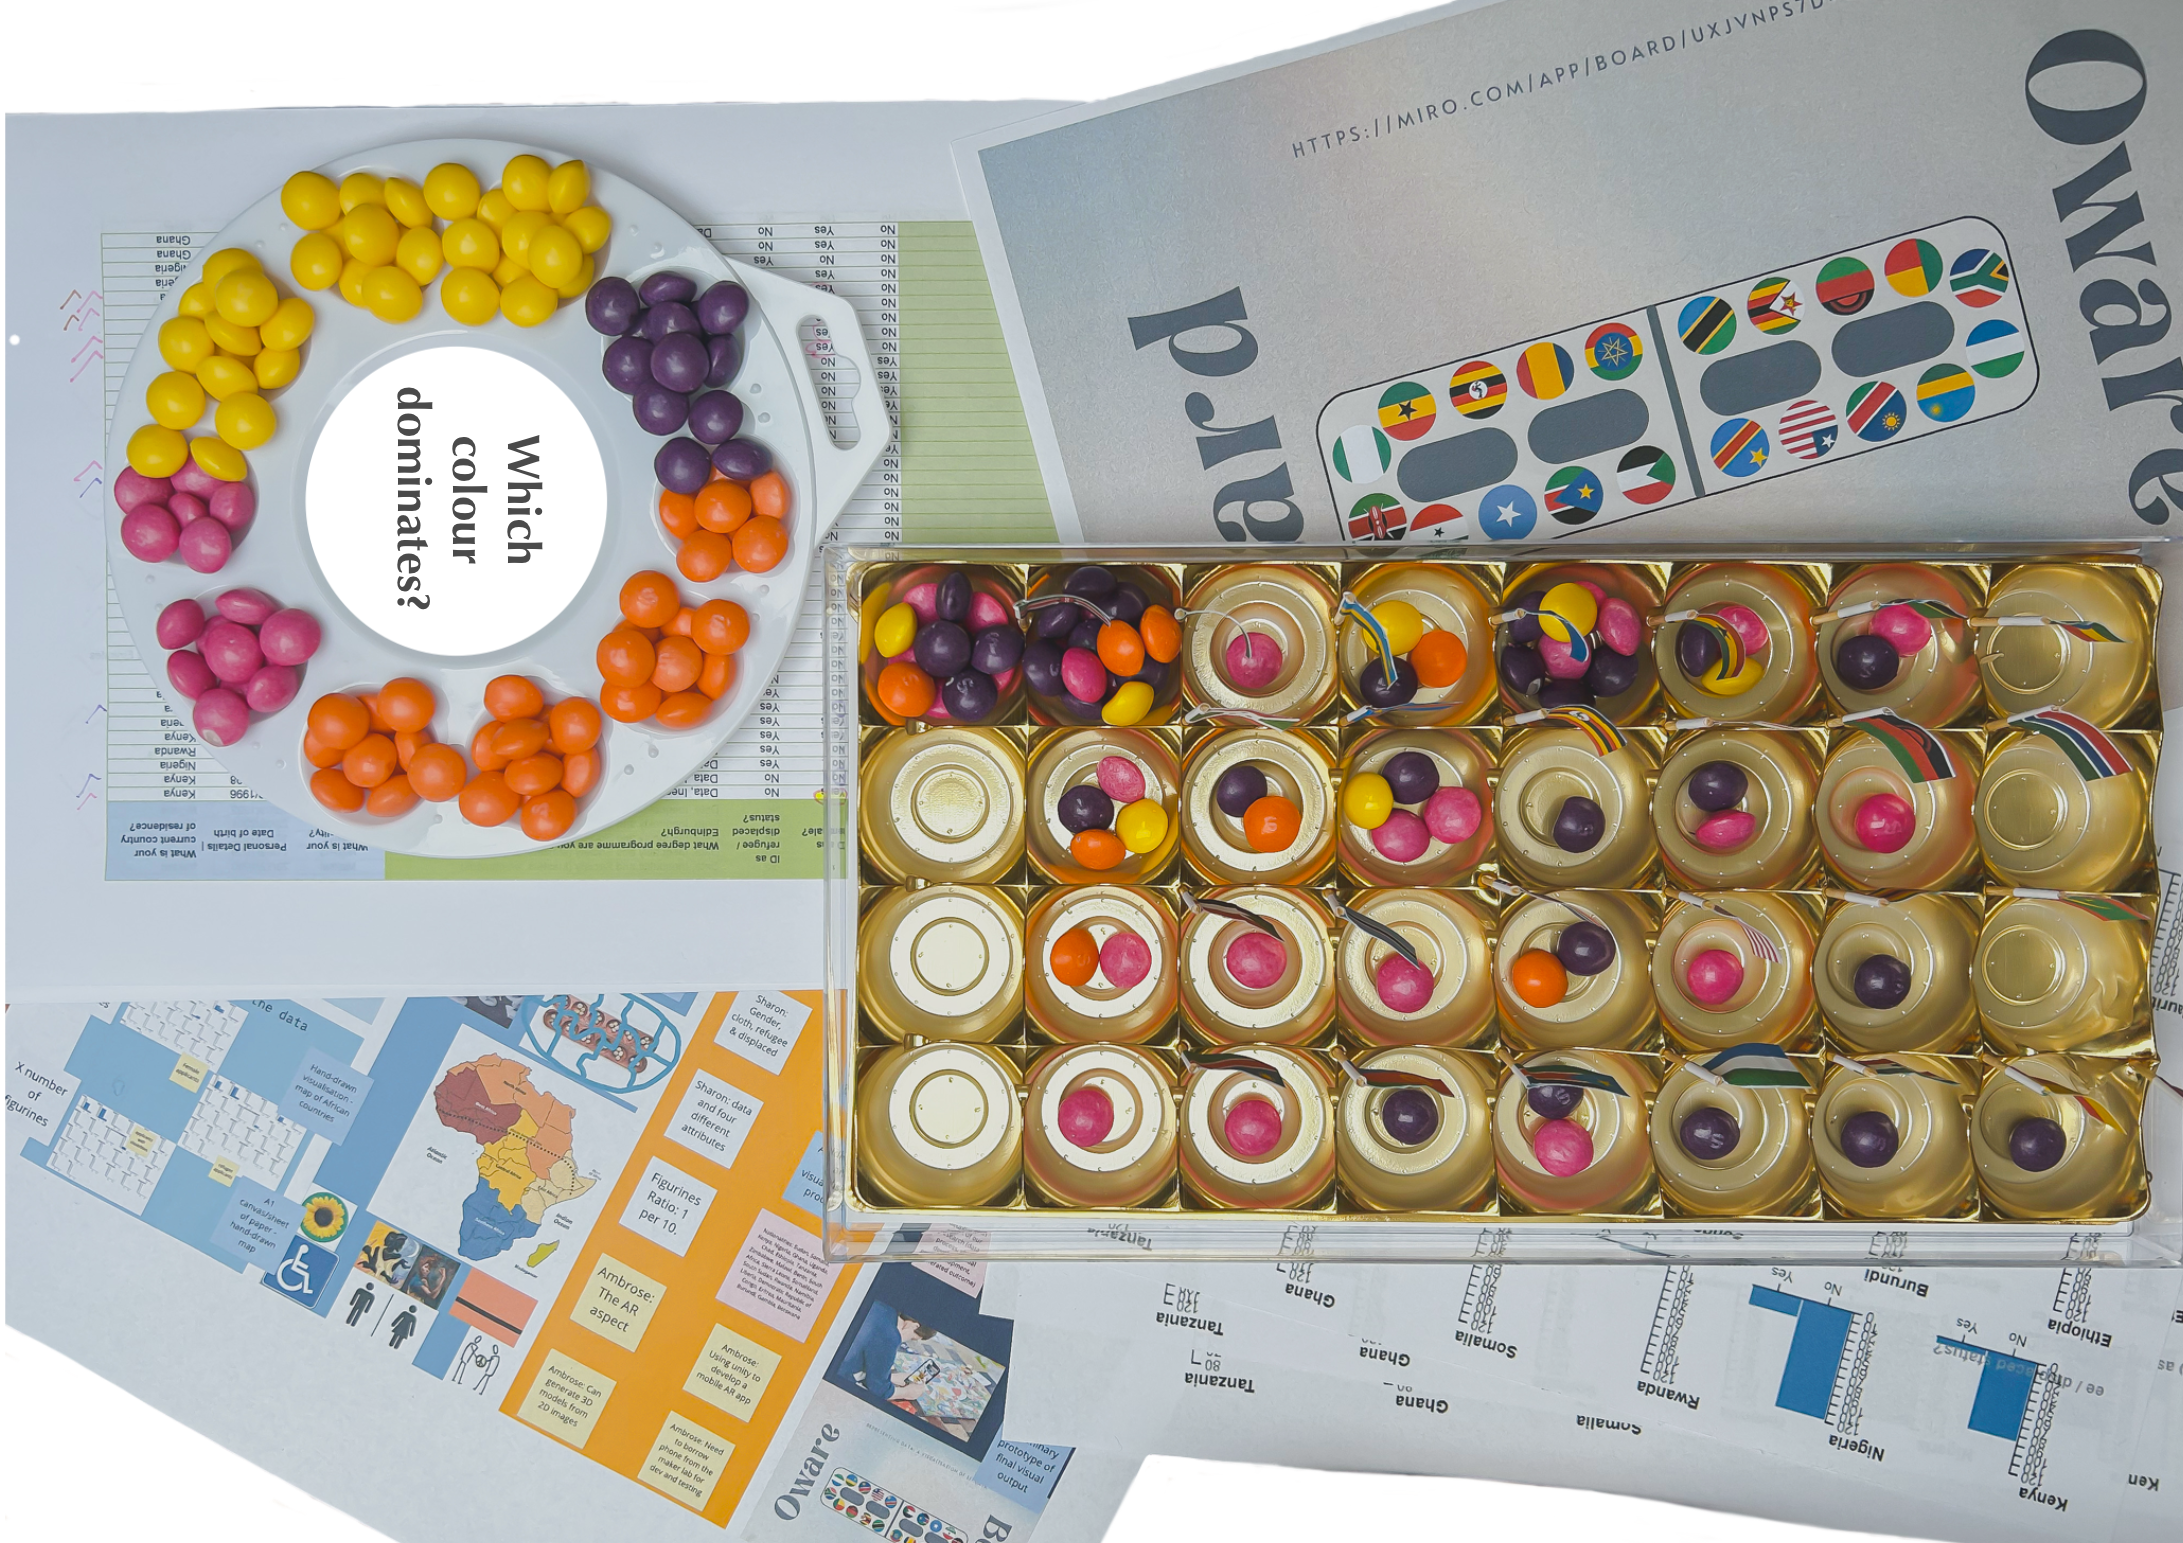
Outcome: To ensure each teammate not only had interest in the project but was also adequately represented, we elected to produce a portfolio composed of different mediums of data representation. This included: data physicalisation (in the format of an oware board made from a Ferrero Rocher box), Tableau, Python, sketching (using A1 paper and paint) and a combination of the aforementioned with the inclusion of 3d printing and image rendering in Illustrator.
Challenge 4: Time management proved to be quite an issue for our team. This was due to each of us having very distinct challenges to overcome. One of our teammates was struggling with their mental health throughout (and neurodivergency) and would feel overwhelmed when communicating online or when presented with tasks that weren’t immediately easy to resolve. Another teammate is working full-time as a staff member of the faculty, and thus had little time outside of work with which to meet-up in-person or to work on the more time-consuming tasks. I have the issue of living 1hr+ from Edinburgh, and I’m currently enrolled in another program whilst also self-employed as a freelancer. Thus, time was extremely valuable and hard to come by for all of us.
Outcome: Our weekly schedule helped with maintaining a routine which assisted in turn with prioritising time for groupwork. However, what helped the most was the fact we all became closer throughout the weeks, and became more willing to help out one another as a result. For example, we met up at our teammate’s place of work (her office off-campus) after 5pm so that she could be involved with the finalisation of the figurines. We also made allowances for our teammate who struggles with mental health – choosing to ask minimal questions when work wasn’t completed before soft deadlines. I also took the initiative to complete my monthly work hours early in the month so that I could then prioritise the group project.
All in all, data representation was a fantastic course that introduced me to a variety of different ways to visualise data. It made data less abstract and less unapproachable by presenting it formats I was either already familiar with or had interest in. However, the group project was definitely the most memorable aspect of the course for a variety of different reasons.