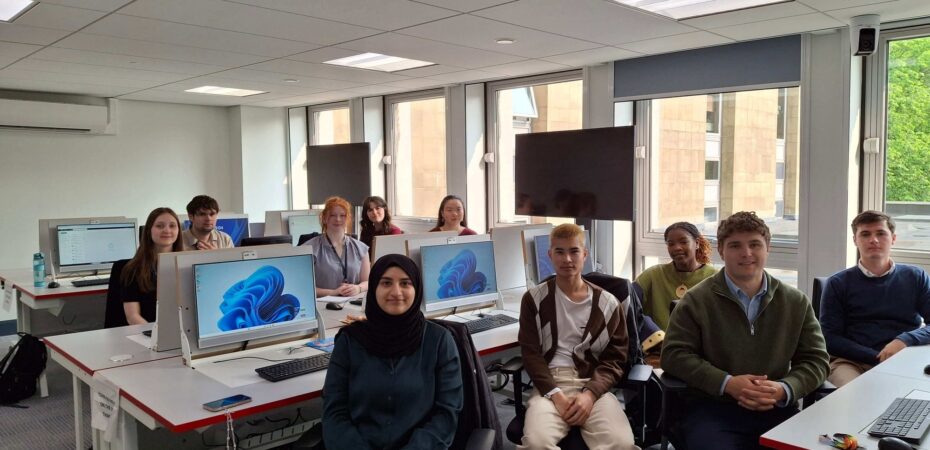
Hi! My name is Holly and after the summer I’ll be in second year, continuing my degree in Economics with Finance at the University of Edinburgh. In the meantime, I have been spending my time doing a 12-week internship with ISG. I have had the great opportunity to be a Learn Foundations Intern, and I thought I’d give an update of how good it’s been so far!

Apart from my core tasks of completing course checks for the upcoming academic year and doing accessibility audits for the previous academic year, I have had lots of exciting opportunities such as training, additional tasks and my personal project. I have been a part of the Moodle migration, automation, and SharePoint creation. Additionally, I’m setting out to document my experiences as a way to remember what I have achieved. It gives me a starting point for my end-of-year internship presentation, where I will let everyone know what I’ve been up to.
Visualising MOOC Data
I mainly wanted to focus on my personal project for this blog post as there are currently ten Learn Foundations Interns and I wanted to give some insight into the unique aspects of my experience. Kelci, another Learn Foundations Intern, and I have been working on a personal project for the second half of the internship. This gives us some freedom to look outwith our main responsibilities and expand on what we are interested in. We initially wanted to do something with accessibility but pivoted to data visualisation. We thought it was a good idea to delve into something we hadn’t really done before, and so we got in touch with Luke and Scott (part of the Education, Design and Engagement team) to further our understanding. They wrote up a fantastic project brief for us to figure out how we were going to get this project on the road.
After our meetup we decided our project was going to be analysing and visualising the University’s short course (massive open online courses, also known as MOOCs) enrolment data for the last 12 months on the University’s online learning partner platforms: Coursera, edX and FutureLearn. We set up a timeline and got to work on the first step: familiarising ourselves with data visualisation.
We got to work on a data visualisation course on Kaggle, this was broken up into easy-to-understand sections and focused on the coding aspect. I personally have never gotten familiar with Python (the language we used throughout the course), so it was another skill that I’ve developed over the summer. We were also advised to review the book Fundamentals of Data Visualization. Both of us read this front to back (we did this task before the Kaggle course as we were a bit frazzled jumping straight into it).

Looking Backwards and Forwards
Continuing on with our project plan, we are planning to use the tool Flourish Studio to make our data visualisations come to life. Then, we are going to write up a report of our progress and findings in time to present at the end-of-internship presentations in August!
Overall, my time as a Learn Foundations Intern with the University of Edinburgh has been amazing so far! It’s been a great opportunity, and I still have the chance to pick up lots of new projects to keep me busy before it comes to an end. Digging into data visualisation has been so insightful! Looking back, I’m glad I still have four weeks left of my internship because everyone has been so lovely and welcoming. One thing I’d advise to new interns would be don’t be scared to ask questions. At the end of the day, everyone is happy to clarify points of confusion and wants to be supportive!


