Name: Lewis
Year of study & degree: Final Year Informatics
Position: Digital Learning
Team within ISG: Digital Learning Applications and Media
Evaluating the performance of AI models is hard, and there is no single benchmark or algorithm used to perform the task. A wide range of metrics exist for various Natural Language Processing (NLP) tasks, with varying degrees of implementation difficulty and compute required.
When given the same transcript evaluation task this time last year, fellow interns and I opted for a manual method. This entailed writing our own captions for a video and comparing this to AI-generated captions, laboriously summing up the number of errors and dividing this by the transcript’s word count to generate an accuracy score. This wasn’t the most enjoyable process, requiring quite a lot of time and effort. Although a feasible approach last year, the significantly larger volume of transcripts needing to be evaluated meant an entirely manual approach would have been impractical. Thankfully a good number of gold standard (human-corrected) transcripts were available from existing lectures and other sources, which solved the most time-consuming part of the evaluation process, meaning the main task required was giving accuracy scores to captions.
The goal of the automated method was to mimic the manual one as closely as possible. I knew this would never be perfect due to the context taken into account in the human method (ignoring omission/inclusion of filler words, for example), but felt aiming for a metric which correlated well with the human method would be sufficient.
The first option explored was the NER model (different from Named Entity Recognition), deemed “the best accuracy measurement for captions yet” and used as a standard in various countries across Europe. It requires a great deal of context and human understanding to calculate, however, since mistakes must be given weightings based on their severity. While it’s possible an LLM could be fine-tuned to perform this task through techniques such as few-shot learning, automating this would require use of an API and could lead to inconsistent results.
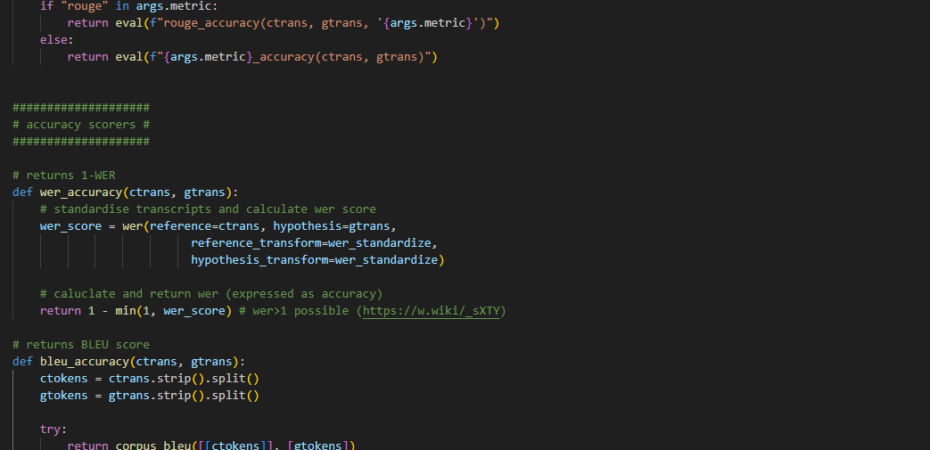
Because of this, metrics able to be implemented with traditional algorithms were sought out and experimented with. Only those with accessible Python implementations were used to decrease implementation time and ensure reliability, since the maths underlying many seemed complicated.
Word Error Rate was the most obvious choice, since it very closely matched the human method and is designed to be used for the task of transcript evaluation. Other methods experimented with include BLEU (normally used to evaluate machine translation) and ROUGE (normally used to evaluate summarisation), which both have accessible Python implementations.
To test which metric most closely matched human scores, last year’s transcripts were gathered and scored using WER, BLEU, and ROUGE variants including ROUGE-1 through ROUGE-9 and ROUGE-L. The test set was expanded by manually scoring transcripts from this year’s videos using the same specification as last year. This led to the following results:
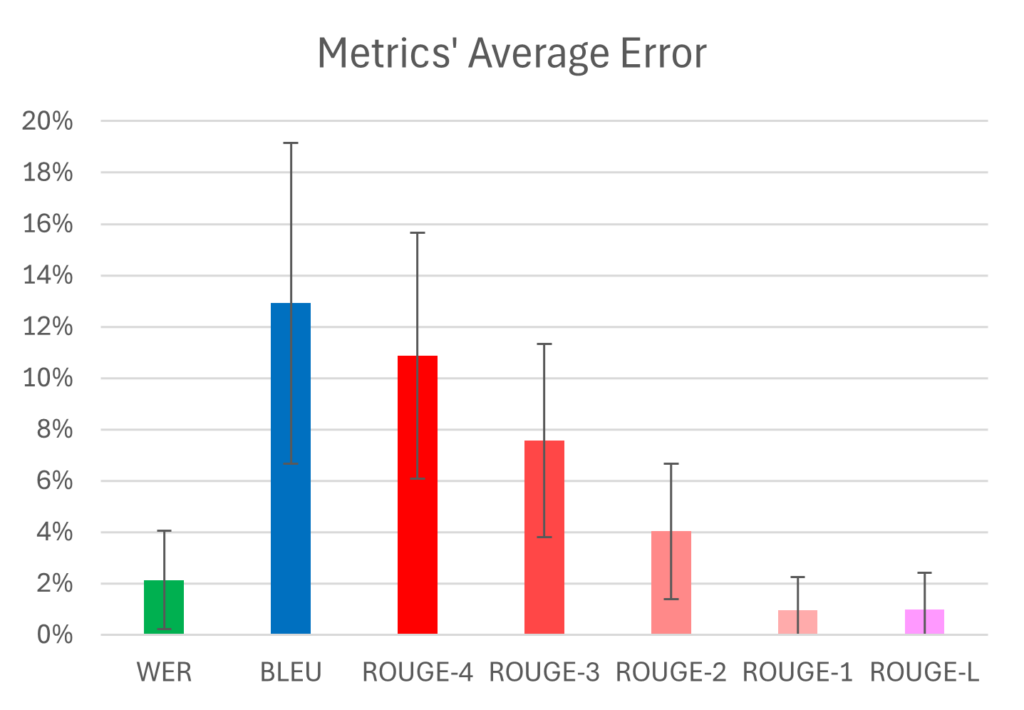
From this chart, we see the average error (“percentage wrong by”) is lowest for ROUGE-L, then ROUGE-1, then WER. With error increasing as n in ROUGE-n increases, and BLEU having the highest error.
WER’s efficacy is not particularly surprising since this metric is very close to the human accuracy scoring method, but it consistently rates transcripts more poorly since it does not take context into account as the human method does. ROUGE-1’s performance is somewhat surprising since it also does not take any context into account, but it is understandably lenient as it only looks at the presence of single words in the AI generated transcript compared to the human written one. This, however, makes it potentially unreliable since the presence of many correct filler words with no correct context could be rated highly.
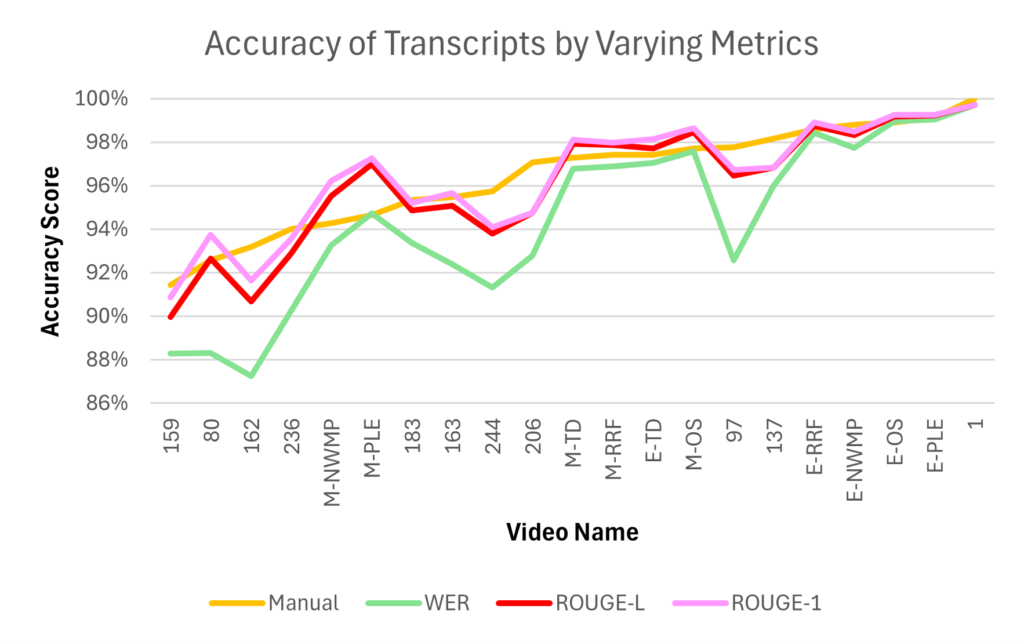
ROUGE-L seems like a much better option since it looks at sequences of varying lengths across the transcripts, meaning more context is taken into account and reliability is greater. It is computationally expensive though, taking 100 times longer than WER to evaluate transcripts (based on experiments using 64 copies of the example files as data). This means it may not be the best option in all scenarios, especially considering it gives similar scores to WER and consistently agrees with how this metric ranks services.
To play around with the command line tool yourself, head to this GitHub repo and follow the instructions. Include the --metric flag in your command to use any of the ones mentioned in this article.