Programme of Study and Year: 3rd Year, Computational Physics
Intern Position: Data production intern
Favourite song right now: Holy by Frightened Rabbit
Hobbies: Mountain biking and bouldering
Describe your role in 4 words: Too many spreadsheets downloaded
Introduction
Hey, my name is Adam and I’m writing this during my data production internship at EDINA. I’m currently on my 7th week working here and it’s been an amazing ride, with so many new experiences and techniques being learned. So what have I been doing and what am I going to do?
As a Data Production intern my main job is well… data production. Over the past 7 weeks I’ve been collecting, extracting, cleaning and analysing data to produce even more data, and I love it! Every day I get to dive into coding problems, each with a different set of challenges to face and overcome. One of my favourite things is problem solving, especially if the reward for completing said problem is something that has an actual impact.
Fuel Poverty Index
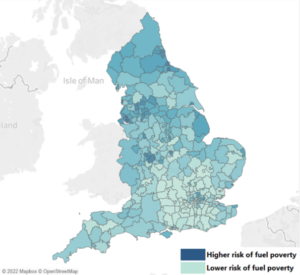
The main project I’ve been working on is attempting to make a Scottish fuel poverty index, where a household is in fuel poverty (defined by the Scottish Government) if more than 10% of the dwellings income is used to pay for fuel to heat the home. I’ve been making an index that ranks each local authority in Scotland on how fuel poor the general populace is, where a local authority is a boundary of land, for example I’m currently in the City of Edinburgh. At the start it seemed like a daunting task and I felt like I might not be good enough to correctly tackle this problem, however as I started learning new techniques to handle data and maybe getting some much needed help from data wrangler and generally cool guy James Crone, I steadily gained more confidence.
One of my main goals in this particular project was to further my coding skills as I want to go into the field of data science where these skills are essential. During my time collecting and extracting the data used for my index I learned a plethora of new Python libraries that I only had a basic understanding in before, the main ones being Pandas and GeoPandas. These libraries enabled me to manipulate the data however I wanted allowing me to gain insights from an otherwise mess of numbers and names. Each dataset had unique challenges to understand and beat, with some datasets needing basic rearrangements of their columns, while others needing full K-nearest-neighbour analysis to find closest points to supermarkets or weather stations.
The project also massively improved my SQL skills, as before this internship my best attempt at SQL was a tiny database on Wetherspoons beverages (don’t ask why). SQL is essentially a computer language that specialises in database management. Now I’m able to write SQL scripts to store large amounts of data in databases as well as extract and manipulate tables inside my databases.
Segmentation of Aerial Photography
The other project I worked on was using Meta’s Segment Anything Model, or SAM for short, on the suitability of accessing EDINA’s Digimap aerial photography. Segmentation is defined as: Segmentation in computer vision is the act of dividing an image into meaningful and identifiable sections.

So basically I would take SAM and feed it images of aerial photography and see if it could identify certain aspects of the image such as buildings, or sheep. Okay the sheep part wasn’t as important here, but I do want to try and see if I could make a sheep counter using powerful AI tools, as I feel like Scotland could have some interesting sheep statistics. Most of this project tested my ability to research topics as a lot of this was entirely new to me and I needed to learn on the fly. I learned about how image segmentation models are accessed using different metrics as well as how to use docker to run different environments.
A large part of this project made me work with geospatial datasets as we wanted to be able to plot the images onto actual coordinates. Geospatial data is just like regular data, but is usually about some point, line or polygon on a map and will have a column that usually includes the coordinates of these geometries. This was really interesting as I got to learn about the different coordinate systems that maps can use, such as the UK using a totally different coordinate system to the well-known latitude and longitude system called the British National Grid. The main way I visualised the images I created was using a software called QGIS which enabled me to plot the SAM images directly onto maps of Scotland. This project enabled me to practice my skills on a variety of different software to further expand my knowledge of data science in the workplace.
Conclusion
In conclusion, I’ve been having an amazing time here. Everyone is very welcoming and friendly and always listen to my concerns, I don’t think I would have enjoyed this experience as much without them. All in all I’ve learned so many new things about office life and coding which will help further my career later on. I’ve really enjoyed being a part of something that is actually being created and can be visualised and I’m going to miss working for EDINA come September when the eventual student grind comes back.


Very nice adam ! well done !