Any views expressed within media held on this service are those of the contributors, should not be taken as approved or endorsed by the University, and do not necessarily reflect the views of the University in respect of any particular issue.

Information Logic Architecture

Breathing is an everyday activity of the human body that is difficult to capture and perceive, and we will present numerical visualizations of the effects of breathing in different states of the human body.

Here are some good references from Pinterest:

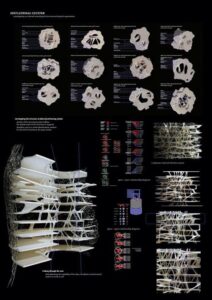
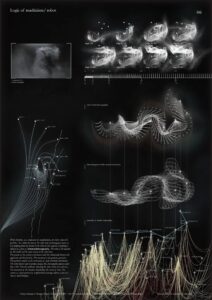
I think it would be more convincing and logical to have an information visualization chart in our outputs to aid the presentation of the project’s touch designer effects, a good project should tie the outputs together rather than make it an island of isolation.

For the next additions to the project process, I think we can refer to the following flow

Leave a Reply

css.php

Report this page

To report inappropriate content on this page, please use the form below. Upon receiving your report, we will be in touch as per the Take Down Policy of the service.

Please note that personal data collected through this form is used and stored for the purposes of processing this report and communication with you.

If you are unable to report a concern about content via this form please contact the Service Owner.

Please enter an email address you wish to be contacted on. Please describe the unacceptable content in sufficient detail to allow us to locate it, and why you consider it to be unacceptable.
By submitting this report, you accept that it is accurate and that fraudulent or nuisance complaints may result in action by the University.

  Cancel