Any views expressed within media held on this service are those of the contributors, should not be taken as approved or endorsed by the University, and do not necessarily reflect the views of the University in respect of any particular issue.
The presentation method chosen by our Presence group is an immersive interactive installation.
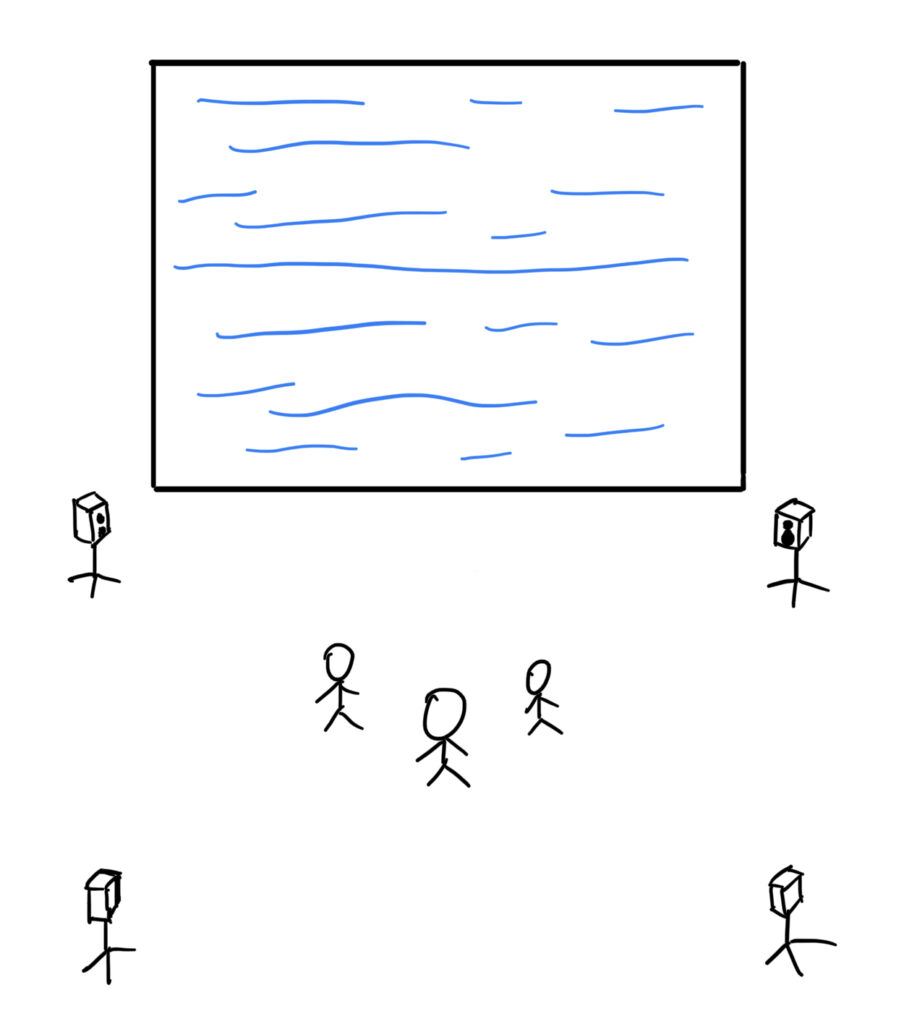
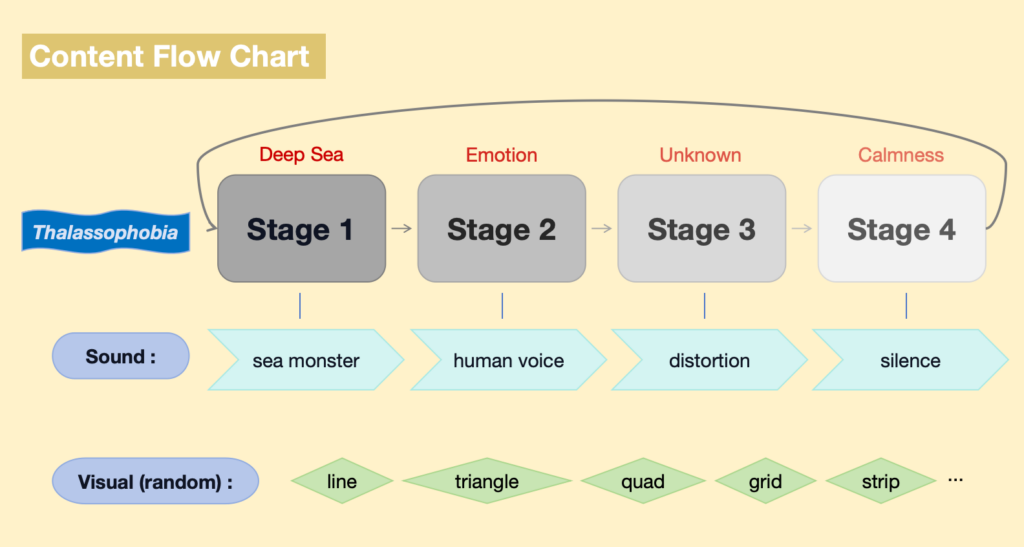
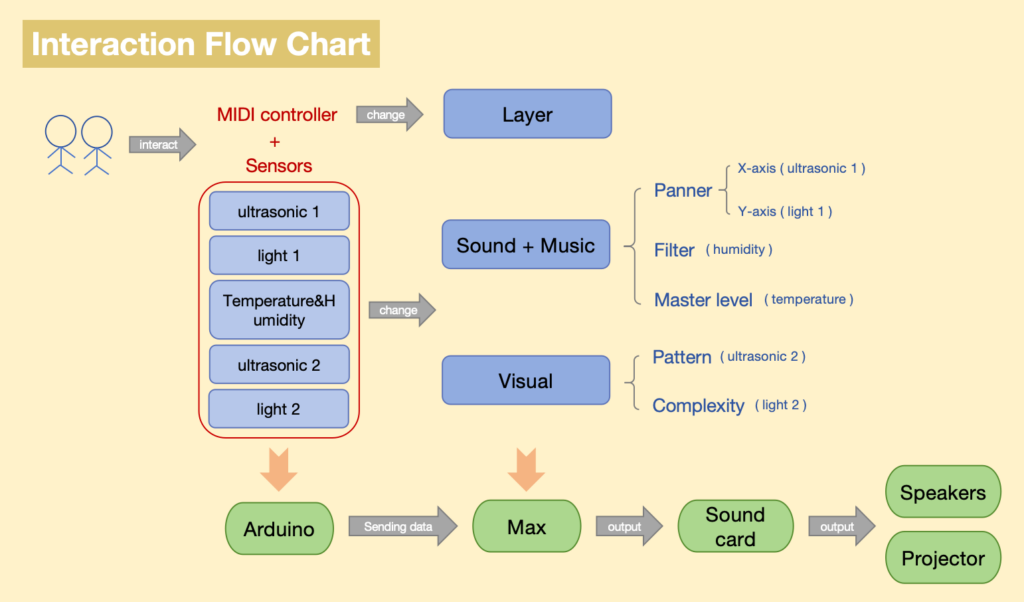
The following is the setup structure diagram (see Figure 1) and flow chart of our installation, including content flow chart (see Figure 2) and interaction flow chart (see Figure 3).
Figure 1: Setup Structure Diagram.
Figure 2: Content Flow Chart.
Figure 3: Interaction Flow Chart.
Then there is the overall interactive operation on site (see Video 1).
Although the final presentation is much better than the previous production, there is still room for improvement through on-site user feedback and personal experience.
The filter effect not as obvious enough. It may be related to the fact that the sound samples are played for too short a time and users cannot quickly feel the filter changes.
The range of ultrasonic sensors could be set more clearly. Although it has almost no impact in actual operation, it can be improved from the numerical perspective.
The interactive connection between sound and vision could be stronger. For example, adding other forms of interaction between the sound part and the visual part in Max to improve this. But this may require a significant amount of time to resolve. I will continue to explore this point towards the end of the course. This will also be a topic worth discussing after the semester is finished.
Personal Reflection
During the production of this project throughout the semester, I found that I was not just doing a group assignment, but also absorbing a large amount of knowledge from various aspects through various channels. I have greatly improved both in terms of technical operations and teamwork skills. This was such a meaningful and worthwhile experience for me.
Technically, I had no experience with sensors before doing this project. Although I know that it is very challenging to choose a brand new thing to study and implement it into actual operations, I still want to try hard. As our project is an interactive installation, interactivity is something I always think about the most. At the beginning, my thinking was limited to optimizing this by modifying some codes in Arduino. This did have some effect, but after many discussions with Jules, Leo and Joe, I gradually discovered that there are many ways and angles to better solve the problem. For example, I can modify the sensor connection method, add some transitional objects in Max, and so on. It gave me more ideas in learning technical skills.
In terms of teamwork, our team has a clear division of labour from the beginning, which makes our subsequent work efficient. But we don’t just focus on the part we are responsible for. We will also help each other when other people’s parts encounter difficulties. My interaction part received strong support from Ruojing and Yuan in the early testing and rehearsals. This has provided me with great help, and I am very grateful to them.
I learned a lot during the making of this project. These 12 weeks of struggle have been a very beneficial experience on my learning path. In the future, I think I will continue to study interaction-related skills in depth and strive to create more creative interactive works.
Thanks to the teachers and classmates who have given us strong support. Special thanks to Jules, Leo and Joe who have been patiently guiding us in technology. And finally, thanks to my hardworking group members.
In the Week 10 lecture, we received feedback from Jules and tutors on the effectiveness of our rehearsals: Since the sensor has many cables, it is not particularly beautiful when viewed on site, so it is best to make several boxes or covers for them, leaving only the sensor itself. We also agreed that this was a very meaningful suggestion and therefore designed the decoration for the hardware installation.
Inspiration
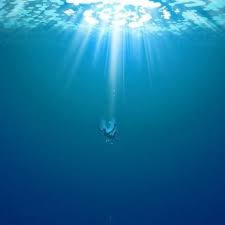
Thalassophobia is the chosen theme for our group. Thalassophobia, as the name suggests, is about the phobia of the deep sea. Therefore, the decoration should be related to the deep sea atmosphere.
In terms of color, we chose the dark blue of the sea. For objects that need to be decorated, in addition to the sensors with many cables there is also the MIDI controller that only need to have one button among many. And they are only allowed to expose the small part that can receive external information for interaction, which is very similar to the bright light seen by a person after falling to the bottom of the sea (see Figure 1, Figure 2 and Figure 3). So we prepared blue and white cardboard, and planned to make two boxes for the two Arduino Unos for vision and sound, and a cover for the MIDI controller that only displays one of the buttons.
Figure 1: Deep Sea Environment.
Figure 2: Deep Sea Environment.
Figure 3: Deep Sea Environment.
Handcrafting Process
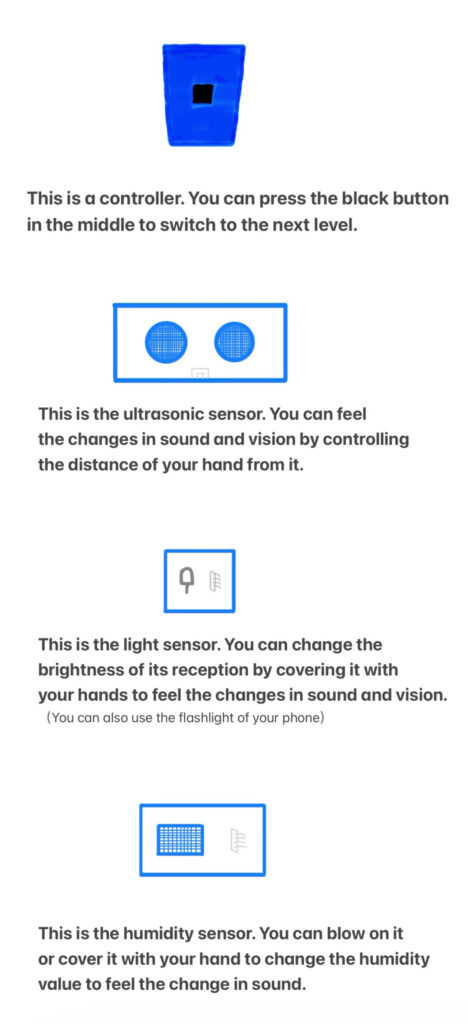
Ruojing, Yuan and I concentrated on handcrafting during the weekend of Week 10 (see Video 1 and Video 2). At the same time, I also produced instructions for using the sensor and MIDI controller, which were displayed to users on two iPad screens on site (see Figure 4).
Video 1: A Video Showing the Sensor Decoration Production.
Video 2: A Video Showing the MIDI controller Decoration Production.
Figure 4: Instructions for Using Sensors and MIDI Controller.
On-site effect
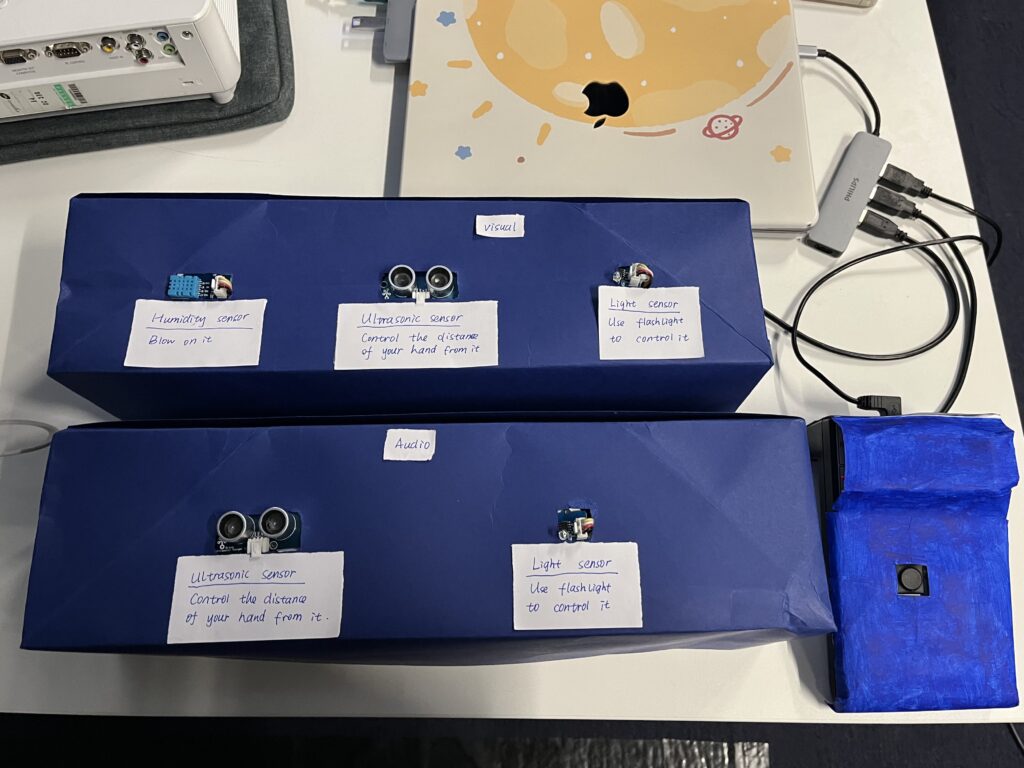
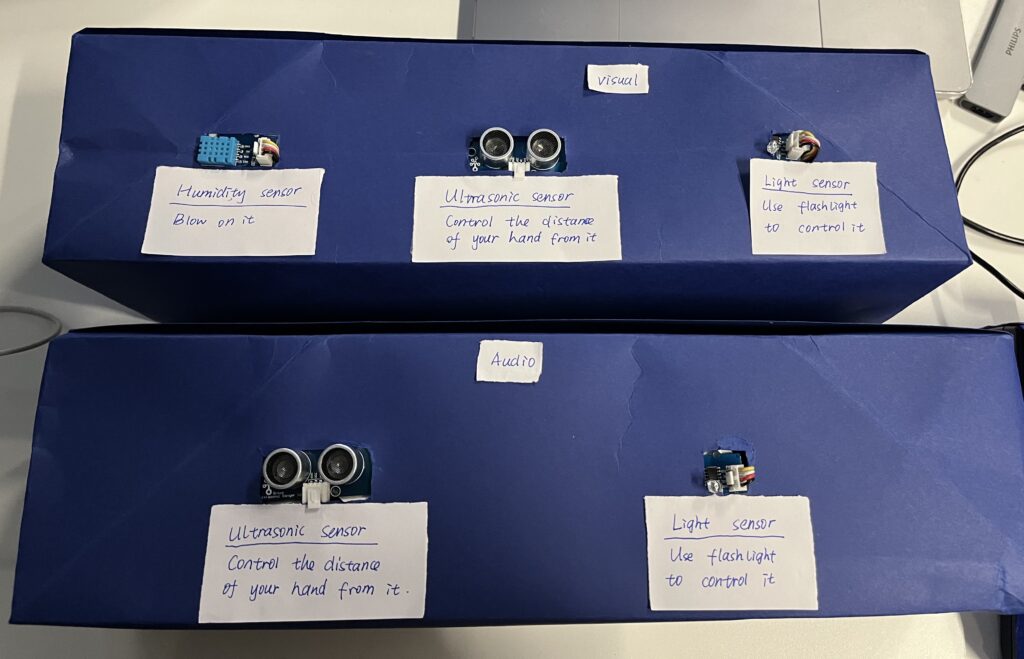
All hardware equipment on site is placed on the table. During the formal presentation, we also received feedback from a tutor who suggested that we could attach the sensor usage instructions directly to the sensor boxes, so that users do not have to glance at the iPad next to them and then come back to interact with the sensor, which reduces some troublesome steps. Therefore, we wrote small notes with instructions for each sensor and posted it on the sensor boxes for the convenience of users (see Figure 5 and Figure 6).
Figure 5: Decoration of Sensors and MIDI Controller.
Figure 6: The Overall Effect of Decoration in the Installation.
For the interactive software, I mainly use Arduino and MaxMSP (see Figure 1). Arduino is responsible for processing the information received by the sensors connected to the hardware Uno, and Max is responsible for receiving the data in the Arduino and connecting it to the Max patch for the audio and visual parts.
Figure 1: Arduino and MaxMSP Software.
Arduino
In the preliminary test, I tested the ultrasonic sensor, light sensor and temperature&humidity sensor respectively and created a separate Arduino project for each sensor.
Here are the videos and pictures of the Arduino project for each sensor.
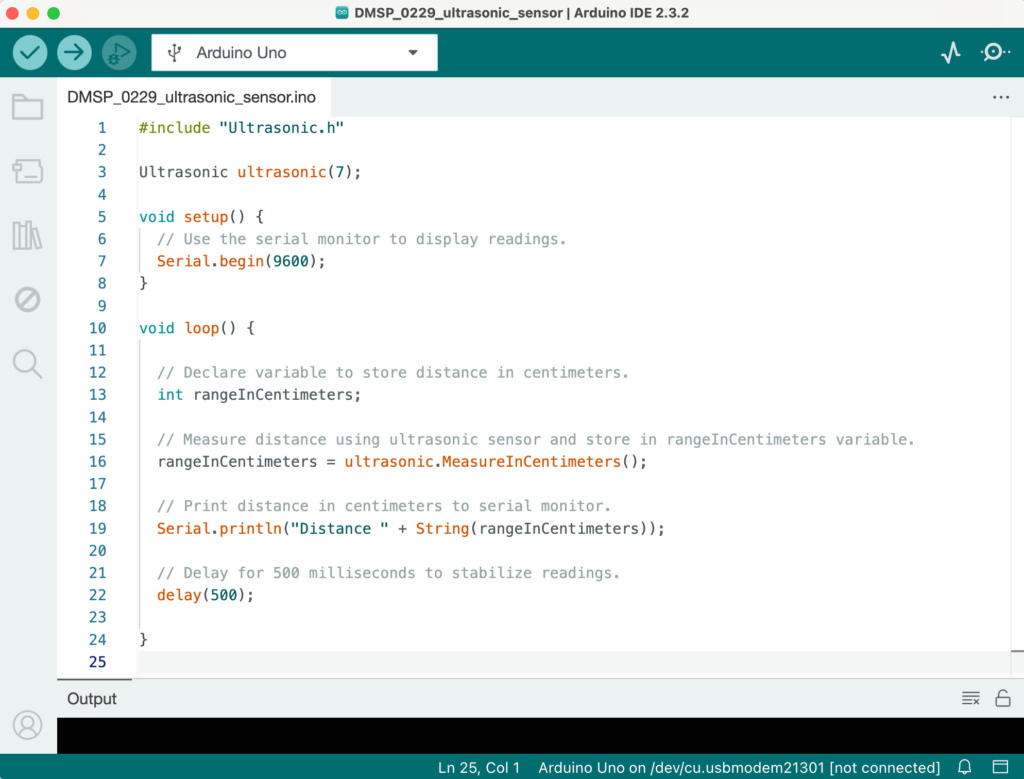
1. Ultrasonic sensor (see Video 1 and Figure 2).
Video 1: Ultrasonic Sensor Connects to Arduino.
Figure 2: Ultrasonic Sensor Separate Arduino Project.
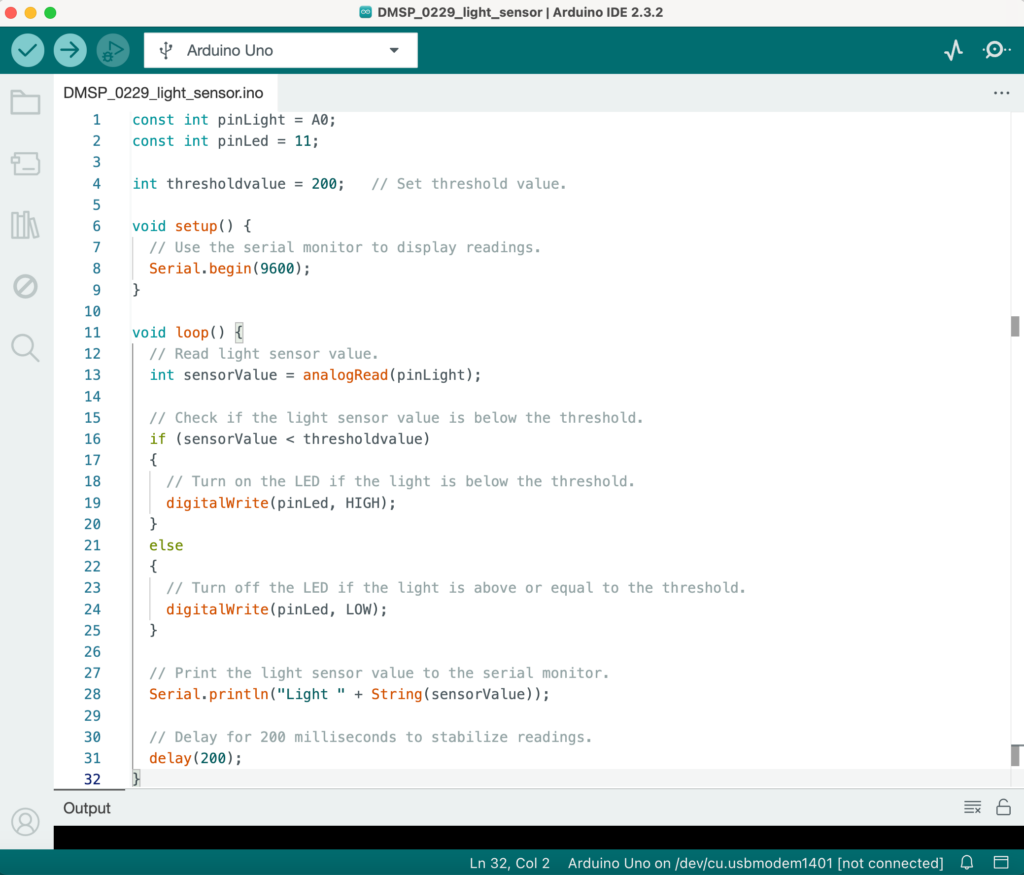
2. Light sensor (see Video 2 and Figure 3).
Video 2: Light Sensor Connects to Arduino.
Figure 3: Light Sensor Separate Arduino Project.
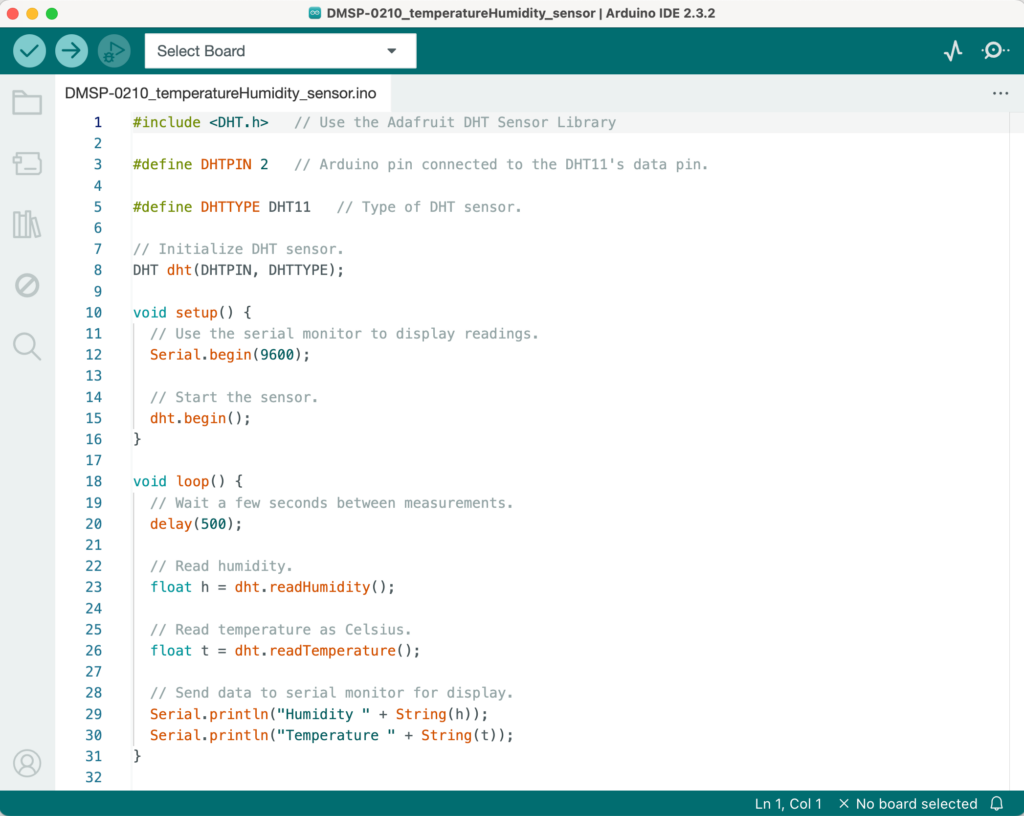
3. Temperature&Humudity sensor (see Figure 4).
Figure 4: Temperature&Humidity Sensor Separate Arduino Project.
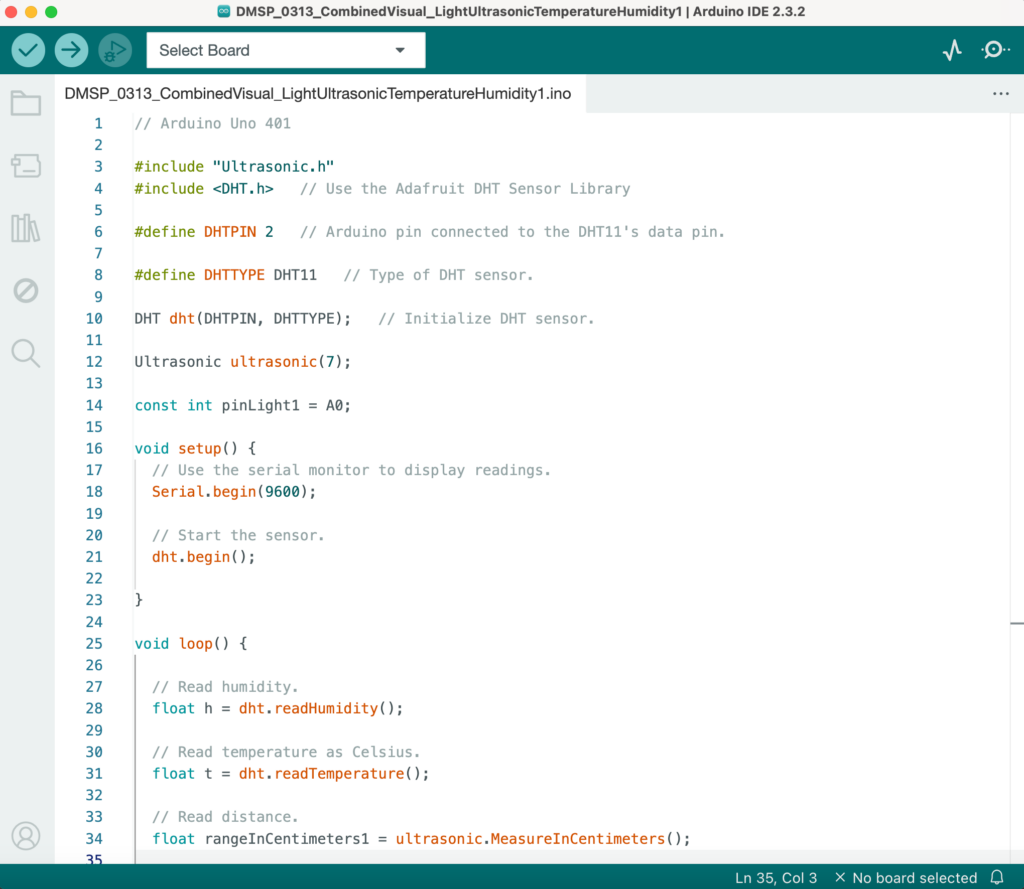
After several weeks of adjustments and optimization, I divided the 5 sensors in the Arduino project into two categories: Audio and Visual according to the on-site classification, thus forming two large Arduino projects. Here are the Arduino project files link:Arduino Project.
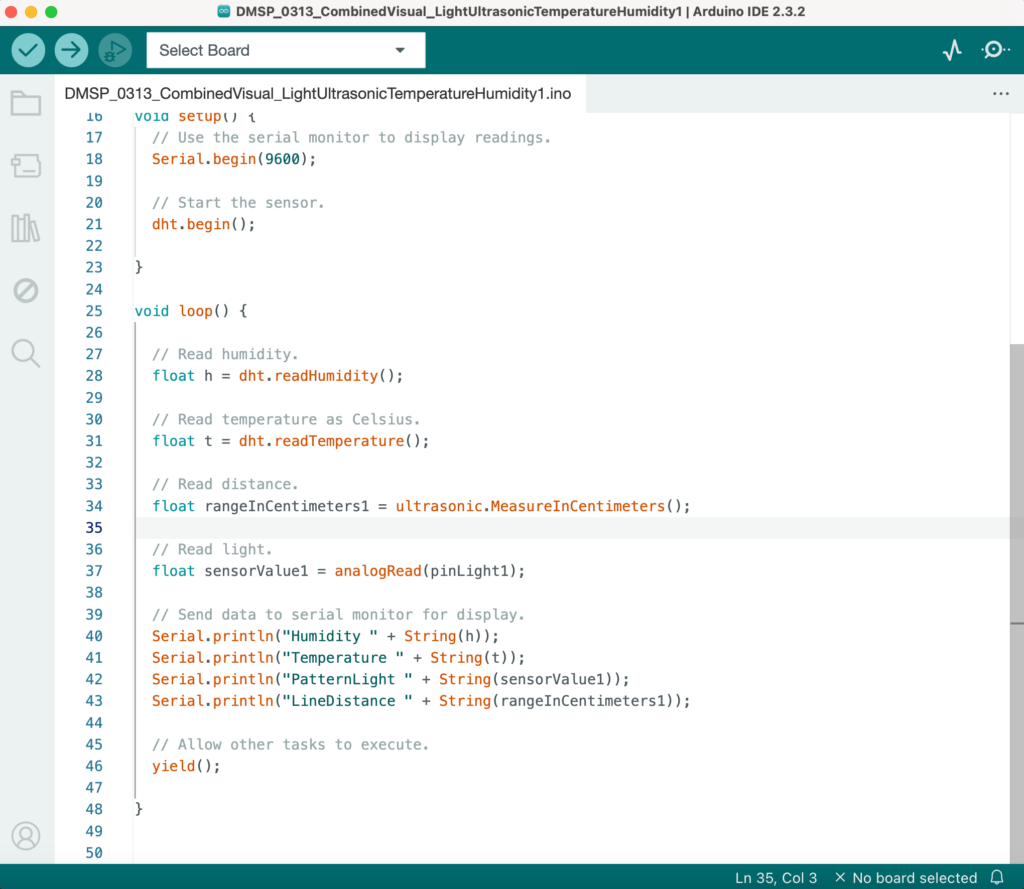
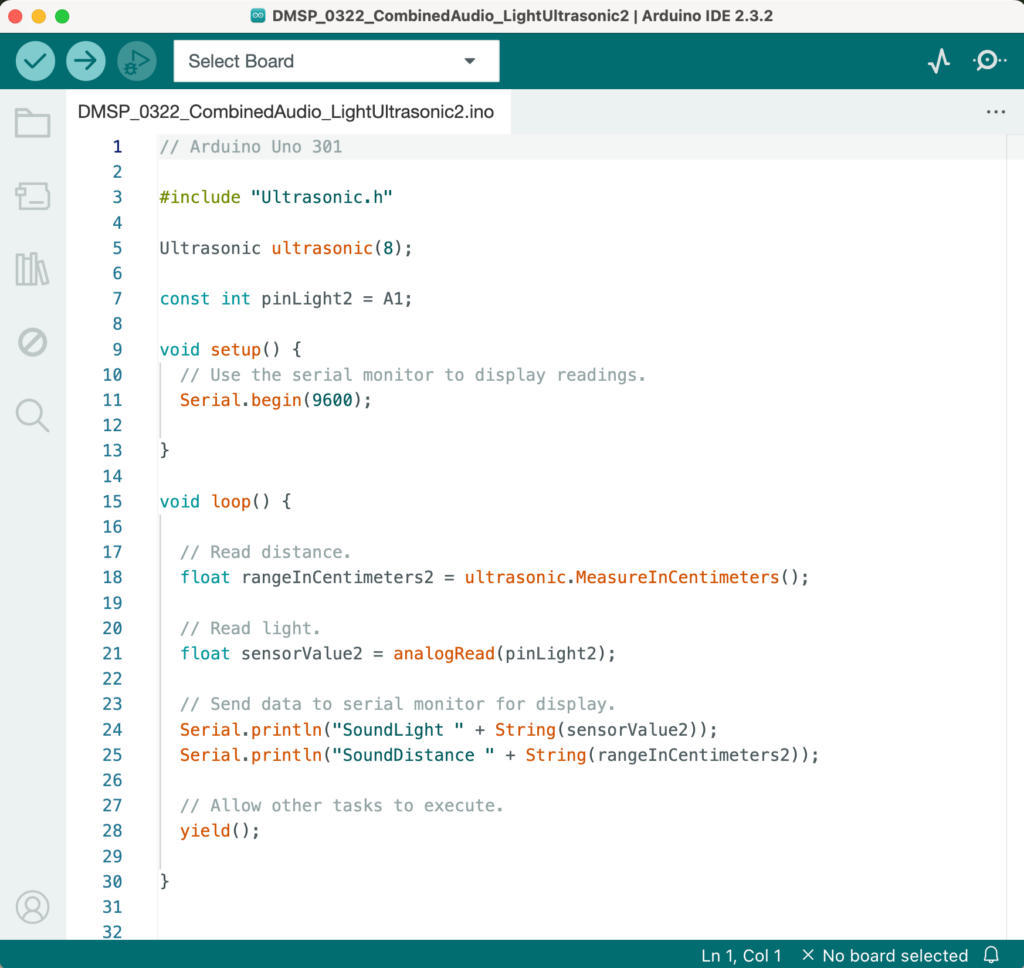
What the Visual project receives is the first ultrasonic sensor that controls pattern type changes and the first light sensor that controls pattern complexity, as well as the temperature and humidity values of the temperature&humidity sensor (see Figure 5). The Audio project receives the second ultrasonic sensor that controls the x-axis of the panner and the second light sensor that controls the y-axis (see Figure 6).
Figure 5: Arduino Project That Combines the Visual Part Sensors.
Figure 6: Arduino Project That Combines the Audio Part Sensors.
During the testing and operation of Arduino throughout the semester, I referred to a lot of relevant materials, such as the following three videos, which were of great help to my hardware and software settings.
However, I still encountered many practical challenges and difficulties throughout the Arduino learning process. The main things that cost me a lot of thought are:
How to connect multiple sensors to the same breadboard and run them successfully;
How to modify the code in Arduino to increase the numerical sensitivity of the sensor;
How to optimize the code in the Arduino project so that data can be sent to Max and both software can run smoothly.
After continuous research and breakthroughs and discussions with tutors, I gradually solved these difficult problems and finally got a more complete Arduino project system.
MaxMSP
The interactive part in Max is mainly the data transmission settings of sensors and MIDI controllers.
1. Sensors Part in Max.
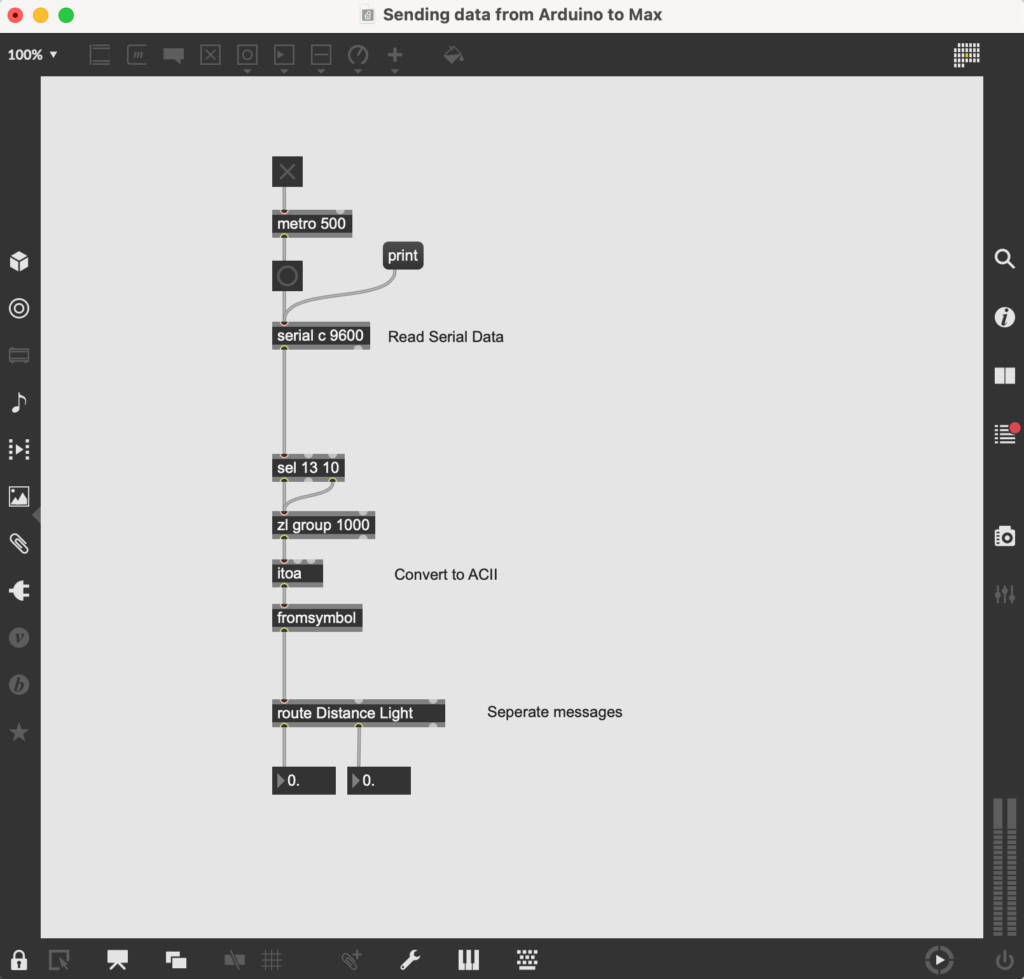
In the sensors part, I mainly started by studying how Arduino sends data to Max. I referred to the tutorial video provided by Leo and successfully created a basic “Sending data from Arduino into Max” Max patch (see Video 3 and Figure 7).
Video 3: Sending data from Arduino into Max Tutorial.
Figure 7: Sending Data From Arduino Into Max Patch.
And after that, I successfully tried running this patch using the light sensor and ultrasonic sensor (see Video 4).
Video 4: Light Sensor and Ultrasonic Sensor Sending Data to Max.
After completing these preparations, I began to formally invest in implementing the specific settings of each sensor corresponding to the specific parameters in the total Max patch. And I added objects for sending data to the visual section and audio section in the Max patch according to the determined categories. Here is the total final Max patch link: Max Patch with required audio samples.
(1) Visual Section.
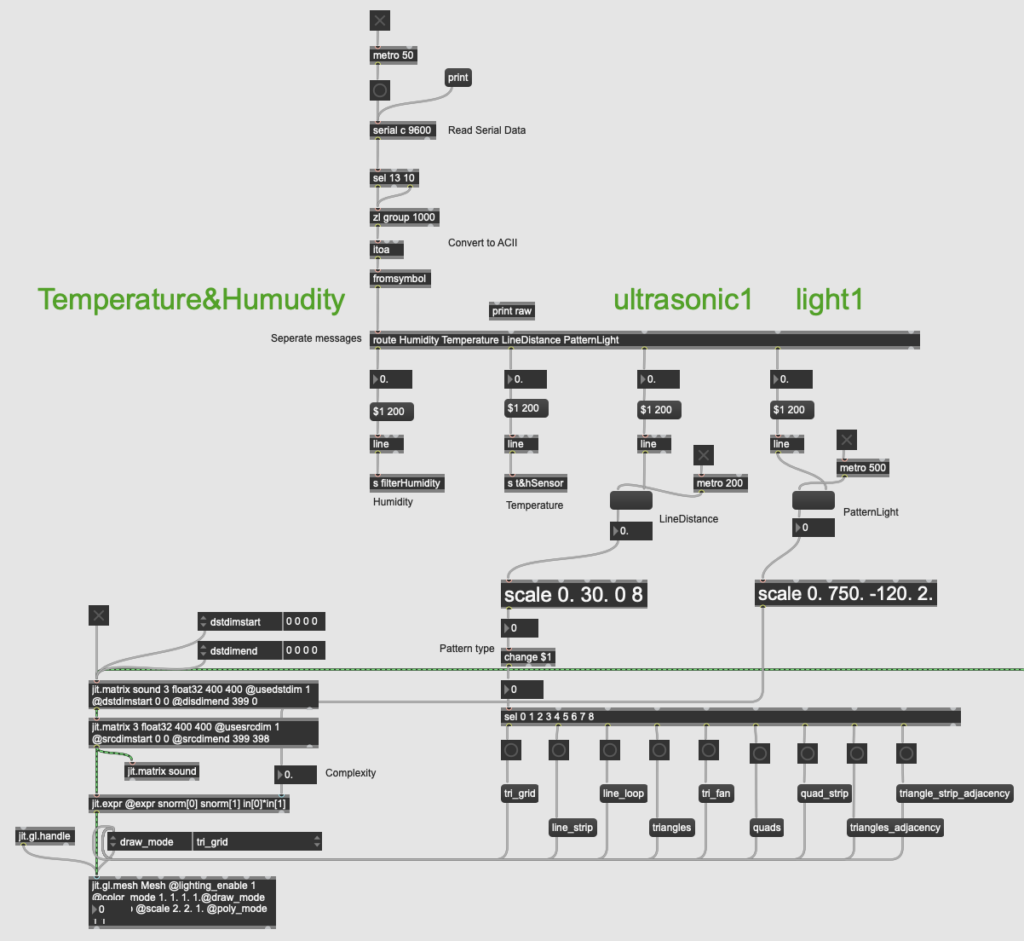
The visual section mainly uses one of the ultrasonic sensors and one of the light sensors. Since the temperature and humidity sensor is connected to the same breadboard as these two sensors, it can only be placed together in the visual section (see Figure 8).
Figure 8: Sending Data from Arduino to Visual Section of Max Patch.
For the humidity and temperature values, I used send objects and receive objects to send them to the filter part and master level part respectively.
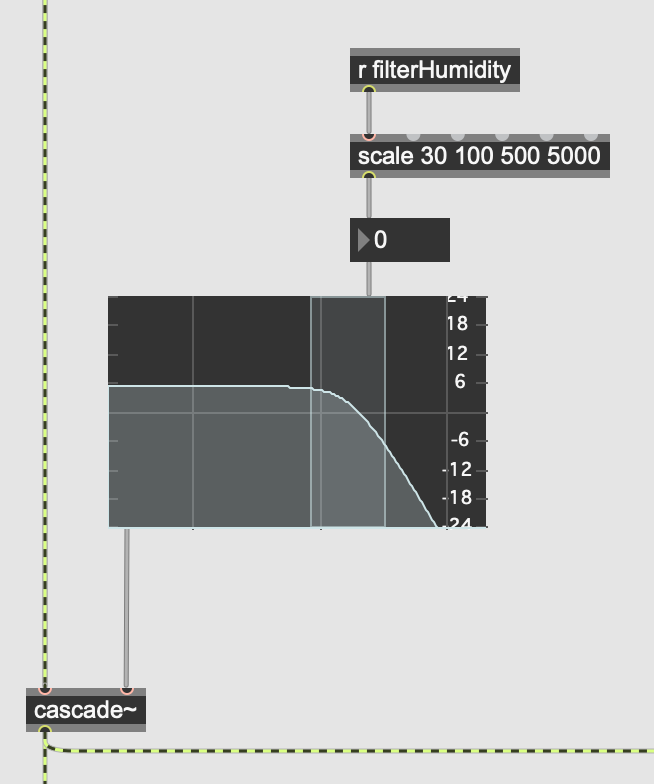
The purpose of this filter is to allow users to experience changes in sound frequency by interacting with the humidity sensor. After Leo’s guidance, I discovered that the cascade~ object can implement audio filter changes. With the filtergraph~ object, the cutoff frequency can be changed by the value received by the sensor (see Figure 9).
Figure 9: Filter Part in Max Patch.
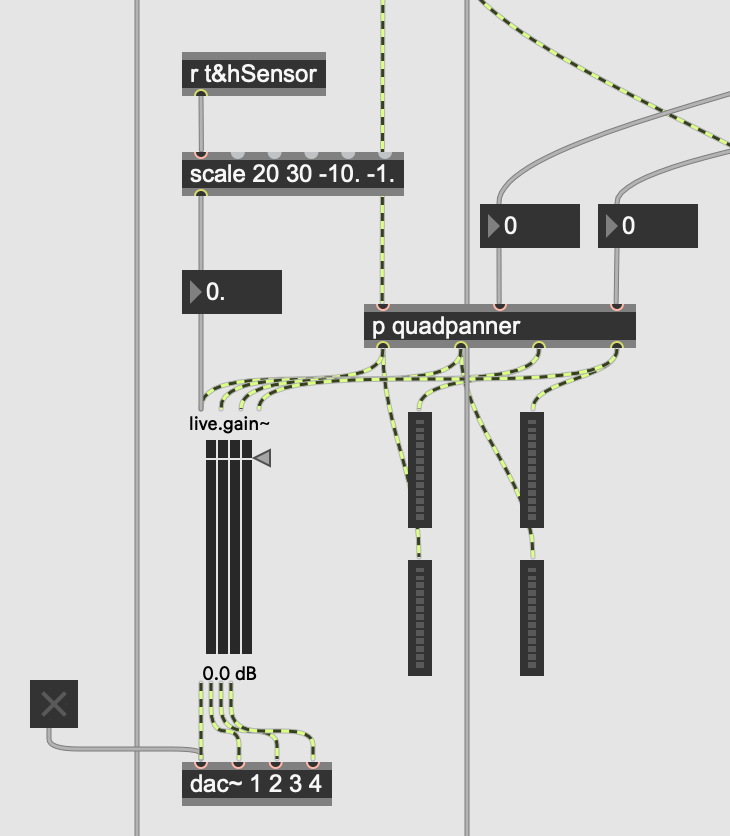
The master level part is set up to avoid the phenomenon that when there are many users in the environment, they produce more sounds, resulting in some users not being able to hear the sounds emitted by the installation. So the less obvious temperature value in the temperature&humidity sensor can be used to control the master level, thus realizing the operation of adjusting the total volume invisibly according to the on-site environmental conditions. That is, the more people there are, the higher the temperature, and the greater the master sound level of the installation. Corresponding to the implementation in Max, I used the live.gain~ object set to four channels to connect it to the panner and dac~ object to achieve master level control (see Figure 10).
Figure 10: Master Level Part in Max Patch.
(2) Audio Section.
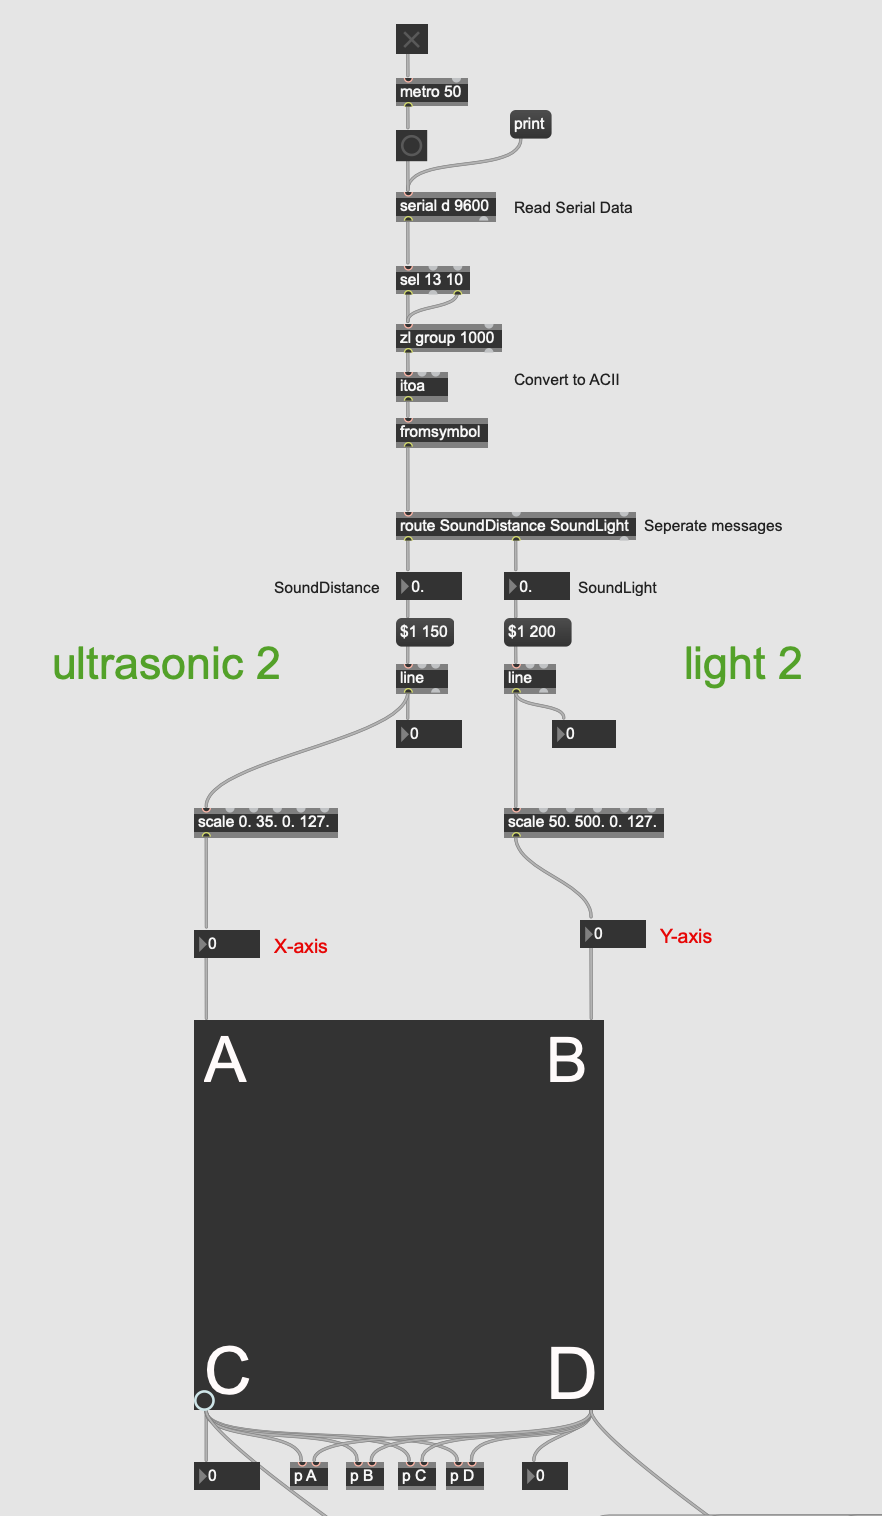
The audio section mainly uses the remaining ultrasonic sensor and the remaining light sensor (see Figure 11).
Figure 11: Sending Data from Arduino to Audio Section of Max Patch.
As can be seen from the figures above, I added a scale object after the value received by each sensor to convert it to the applicable range of each parameter. And I also added line objects in front of some parameters and set appropriate metro values for them, so that the value changes more smoothly without lag.
2. MIDI Controller Part in Max.
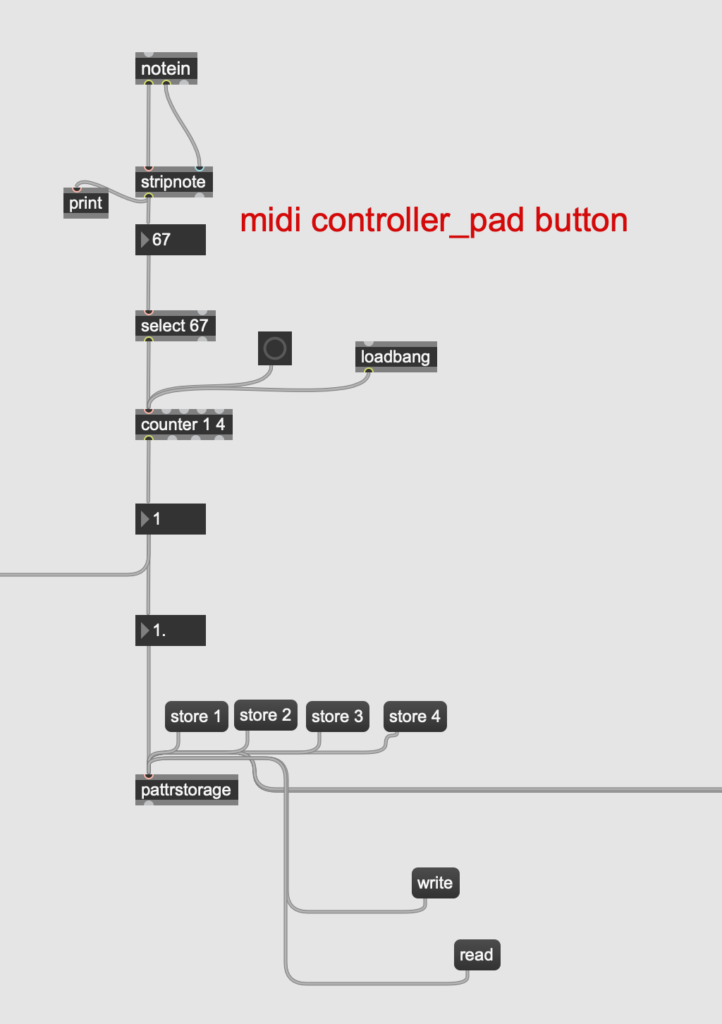
The role of the MIDI controller in our project is as a button for switching layers. During the rehearsal, I tested that the button on the MIDI controller we wanted to use had a corresponding value of 67 in Max, so I used the select object after notein object to select this value (see Figure 12).
Figure 12: MIDI Controller Part in Max Patch.
However, I actually encountered difficulties during the setup process. After connecting all the objects at the beginning, I found that when I pressed the button once, the counter would count twice. Later I found out that it was because Max received the value 67 twice when I pressed the button and released the button. But what I wanted is that Max only receives the value when the button is pressed. So I sought Leo’s help, and he guided me to add a stripnote object after the notein, which can filter out the note-off information and leave only the note-on information, achieving the effect I wanted.
The final effect is that when the user presses this button, Max will receive an input of 67 values, so that the counter counts up once to achieve the purpose of switching to the next layer.
Feedback and Reflection
I received a lot of feedback on site and had some personal reflections after the final presentation. Here are the detailed descriptions: Feedback and Reflection
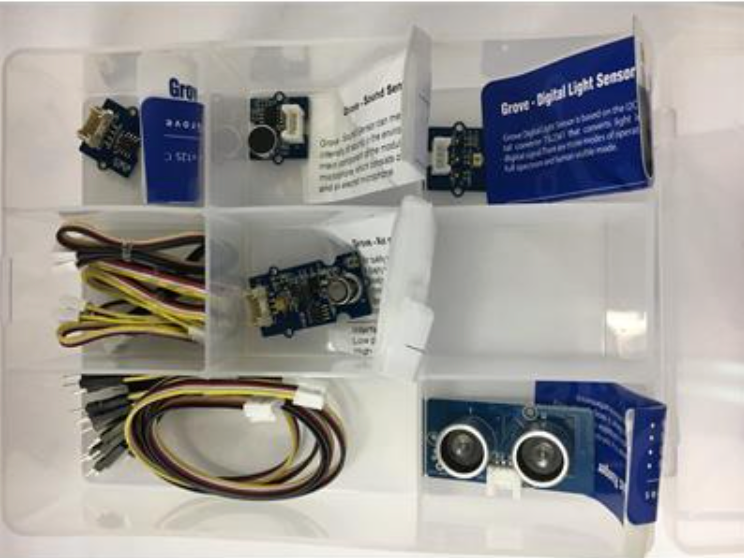
In the first half of the semester, I tried many kinds of sensors in the Grove sensor kit, such as light sensor, sound sensor, air quality sensor, etc. But then it turned out that some of the sensors did not work with our installation. For example, the sound sensor needs to receive sounds above a certain sound pressure level before it changes its value. However, our project is an immersive audio-visual installation. If users keep making sounds to interact with the sound sensor, first of all, it will affect the immersion. Secondly, the sound sensor itself will also receive the sound in the installation, thus reducing the user’s interactivity. Therefore, after constant attempts, I finally chose 2 ultrasonic sensors, 2 light sensors and a temperature&humidity sensor that have obvious numerical changes and are very suitable for our installation.
Among them, the ultrasonic sensor and light sensor are more convenient to operate. Their easy-to-operate feature is very suitable for parameters that require obvious changes. So I used them together to change the sound panning and visual parts.
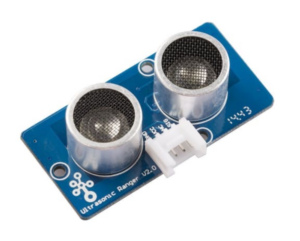
The ultrasonic sensor changes the value generated by the change in the distance between the object and it (see Figure 1). Users can interact with it by moving their hands closer or farther away from it to change the distance to it. The greater the distance, the greater the value it generates, and vice versa. Generally, the distance range that it can receive in real time is between 0 and 500, but the actual more sensitive part when people interact with it is between 0 and 50. I use it as a controller to change the X-axis value of the sound and music panner and change the visual pattern types.
Figure 1: Ultrasonic Sensor.
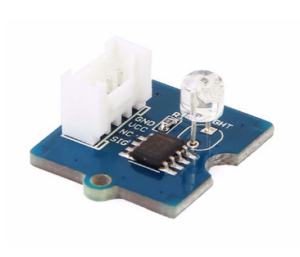
The light sensor changes the generated value based on the different brightness received (see Figure 2). Users can use the flashlight in the mobile phone to shine on it to control its numerical changes. The greater the brightness, the higher the value, and vice versa. Usually the range of values is approximately between 0 and 750. So corresponding to the ultrasonic sensor, I use it to control the Y-axis value of the panner for sound and music and the complexity value of the visual pattern.
Figure 2: Light Sensor.
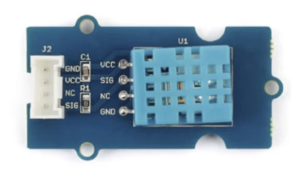
The temperature&humidity sensor can receive two values of temperature and humidity (see Figure 3). Users can change its value by heating it with their hands or blowing on it.
Figure 3: Temperature&Humidity Sensor.
Similarly, the higher the temperature or humidity received, the greater the corresponding value. But what is special is that the temperature usually changes slowly, ranging between 23 and 28; while the humidity changes quickly and in a large range, usually between 35 and 100. So I used the temperature and humidity values to control two different types of parameters respectively.
Temperature value is used to invisibly control the overall volume of the installation. Because sound levels increase when there are more people in the environment, this may result in some people not being able to hear the sound in the installation. The characteristic of not changing significantly in temperature is suitable for improving this. That is, the more people there are, the higher the temperature, and the greater the master sound level of the installation.
The humidity value that changes significantly is used to control the cutoff frequency of the sound filter. Obvious filter changes are very helpful to enhance interest.
Setup
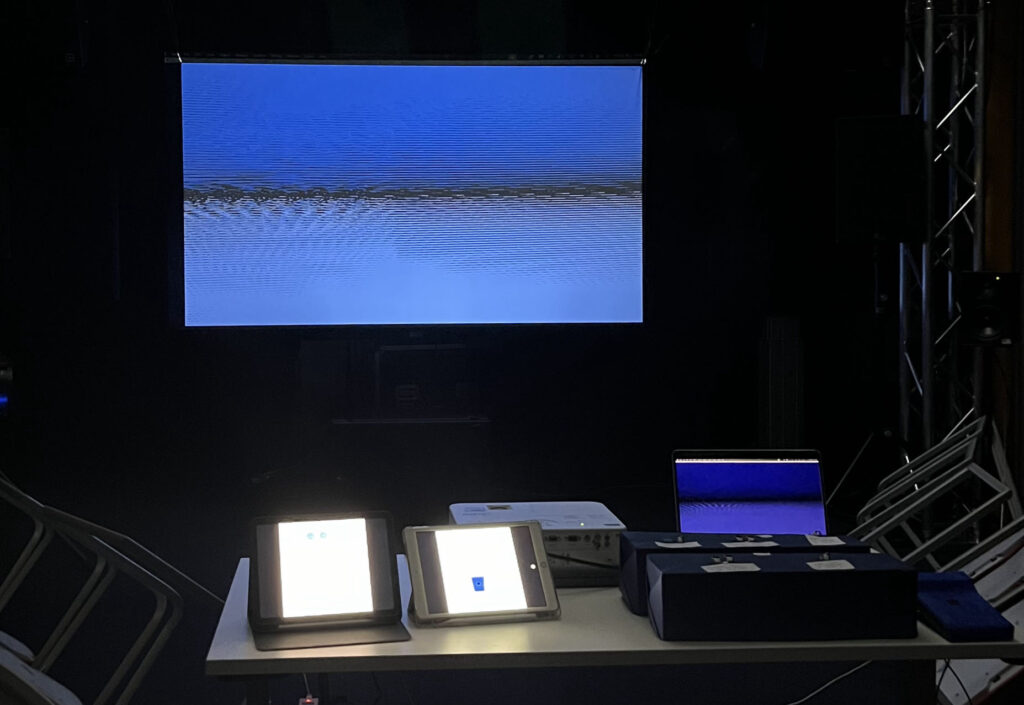
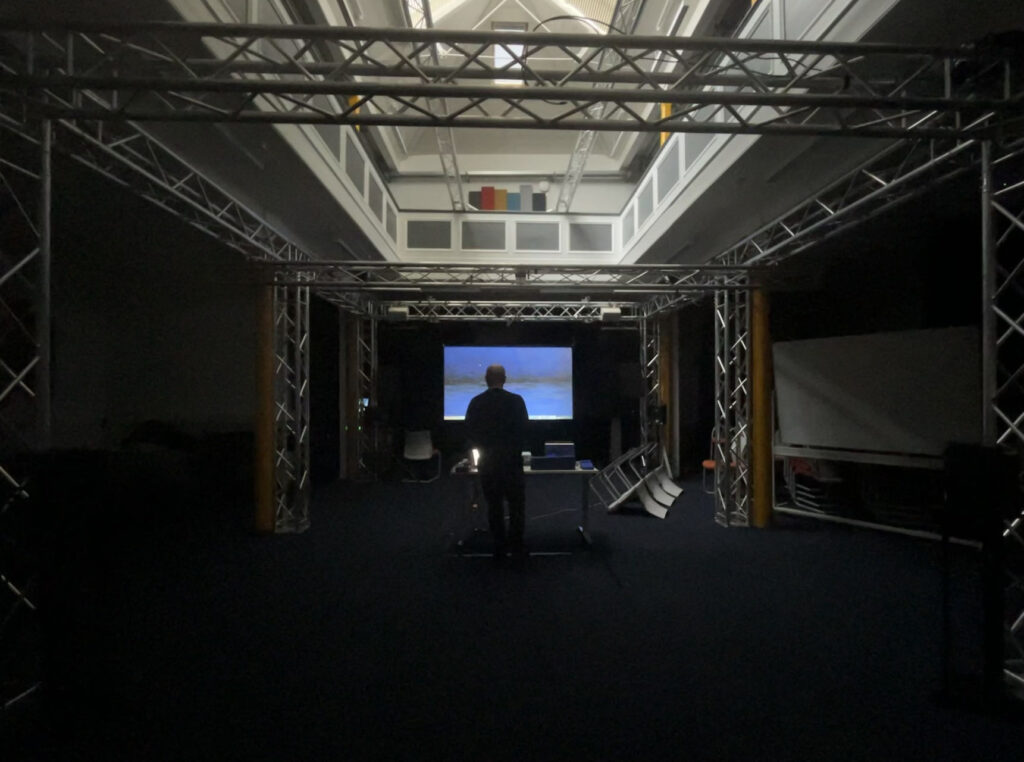
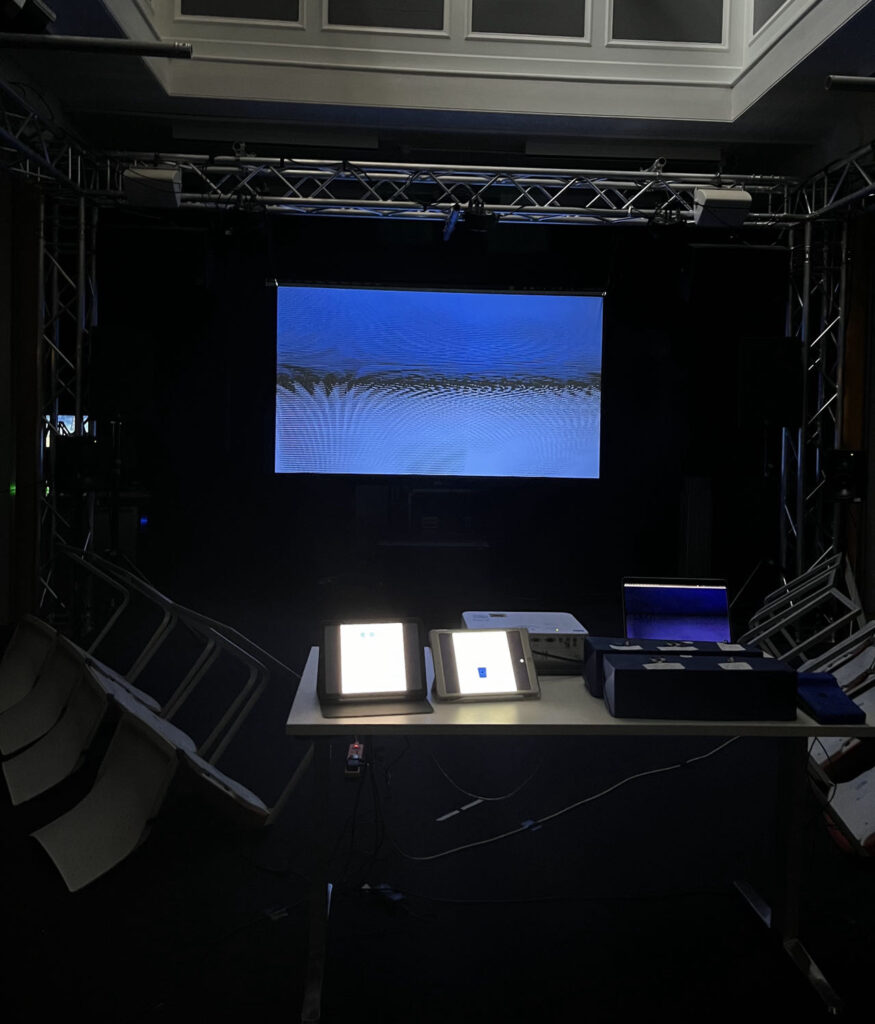
On site, our interactive devices are placed on a table in the middle of the Atrium (see Figure 4). Users need to walk up to the table to interact with the installation. With four speakers placed around it, users can feel an immersive experience in the center.
Figure 4: Location of Tables for Interactive Media.
The placement on the table is based on Jules’ suggestion, placing the two sensor boxes, Audio and Visual, in columns so that the sound and visual sensors could be interacted with at the same time, strengthening the connection between audio and vision. The MIDI controller is placed on the right side of the sensor to facilitate users to switch to the next layer (see Figure 5).
The form of the project our group wants to create is an immersive interactive installation. In the process of formulating the preliminary plan, I found several past cases for reference, in which the interactive part was relatively similar to my idea of the interactive part of our installation.
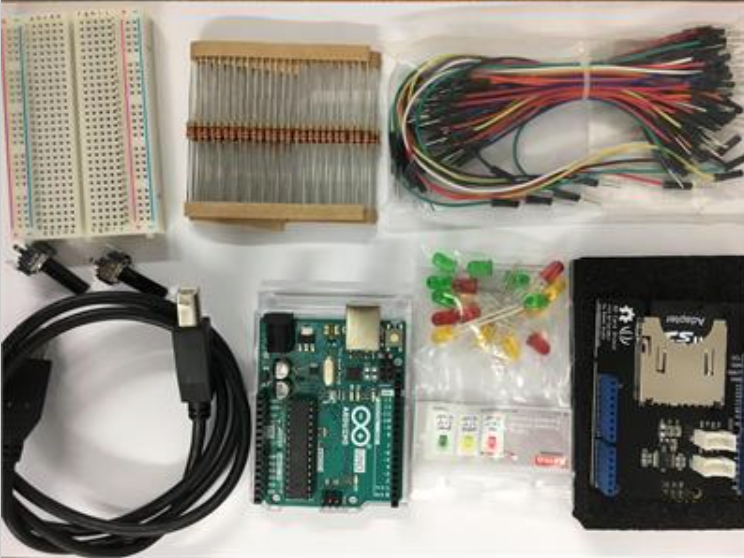
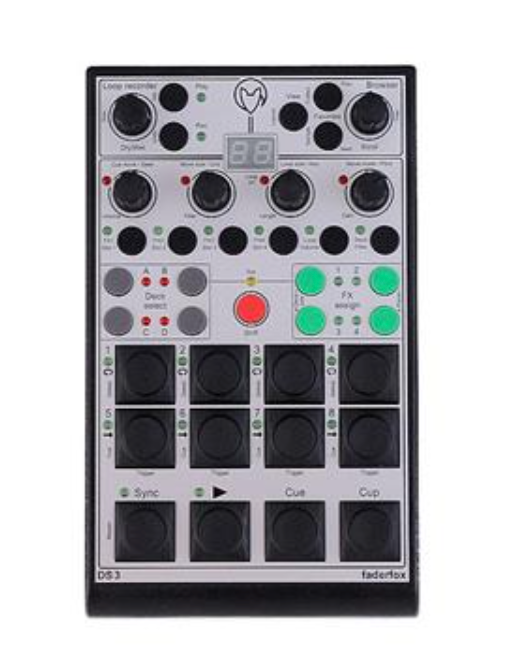
Interaction is one of the most important part of our group’s project. It determines the integrity, user experience and interest of the entire installation. So among various interactive media, based on controllability and innovation, I finally chose the Grove sensor and Arduino Uno (see Figure 1 and Figure 2). Additionally, we need a “button” for switching levels. Considering simplicity and ease of placement, we chose the Faderfox-DS3, a small MIDI controller, as this button (see Figure 3).
This week is final presentation week. The time set by our presence group is from 18:00 to 20:00 on Wednesday night, at the Atrium of Alison House. The reason for setting it at night is that we want a darker environment, which will greatly increase the immersion for our installation, and the value of the light sensor will be easier to control. But the sudden arrival of daylight saving time caught us off guard. Although the brightness is higher than originally expected, the on-site effect is still relatively good.
Following are some videos of the final installation:
Sensor Sensitivity Issues
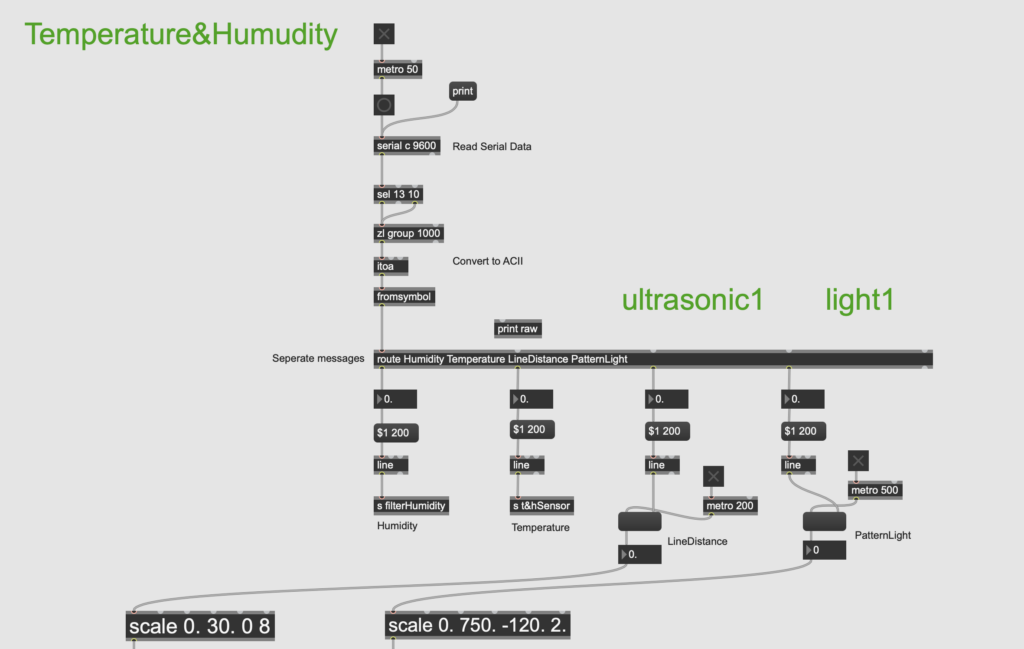
In the afternoon before setup on the day of the final presentation, I met with Joe at the scheduled time to resolve the sensor sensitivity issue. Joe pointed out the problem with the sensor sending data part of the original Max patch, that is, I divided the information received by the sensors on the same Arduino Uno into two route objects (see Figure 1).
Figure 1: The Sensor Sending Data Part in the Original Max Patch.
This will cause Max to only receive one of the sensor data allocated by the route object, and cannot output the data of all sensors at the same time. After gathering all the data into a route object, the data transfer ran normally (see Figure 2).
Figure 2: The Sensor Sending Data Part in the Modified Max Patch.
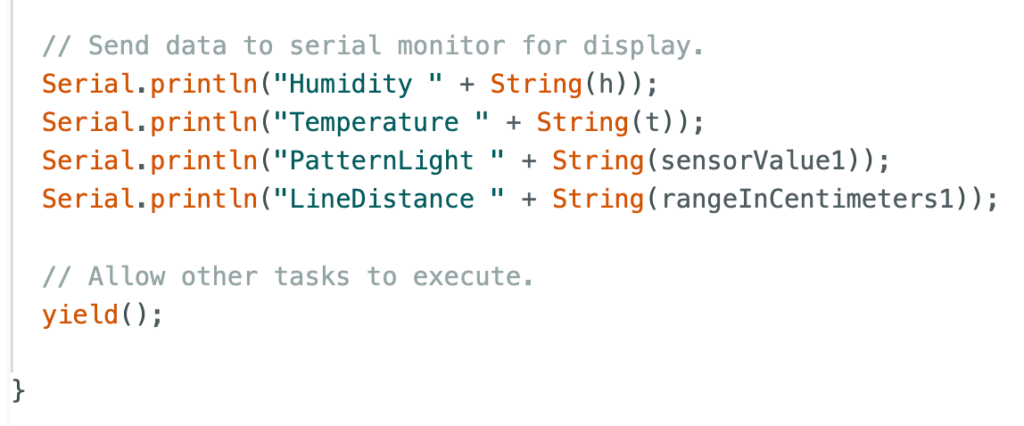
In Arduino, Joe suggested changing delay() to yield(), so that the code can run step by step without affecting the progress of other tasks (see Figure 3).
Figure 3: The Application of “yield()” in Arduino Project.
After these adjustments, the sensor sensitivity problem was successfully solved. This greatly helped improve the integrity of our installation while ensuring fun.
Ending
In addition, we intensively discussed the ending settings before the final presentation. Considering that each user’s perception of emotions is different, some people may want to escape from the environment after calming down, but some people may still be immersed in it and want to feel it again. So we decided not to limit the specific ending, but to let users choose which level to end the experience. This means that the four levels are in some kind of loop. After users press the button to reach the fourth calmness level, they can continue to press the button to restart the first level, and so on. That is, users can press the button an unlimited number of times until they want to end at a certain level.
Feedback
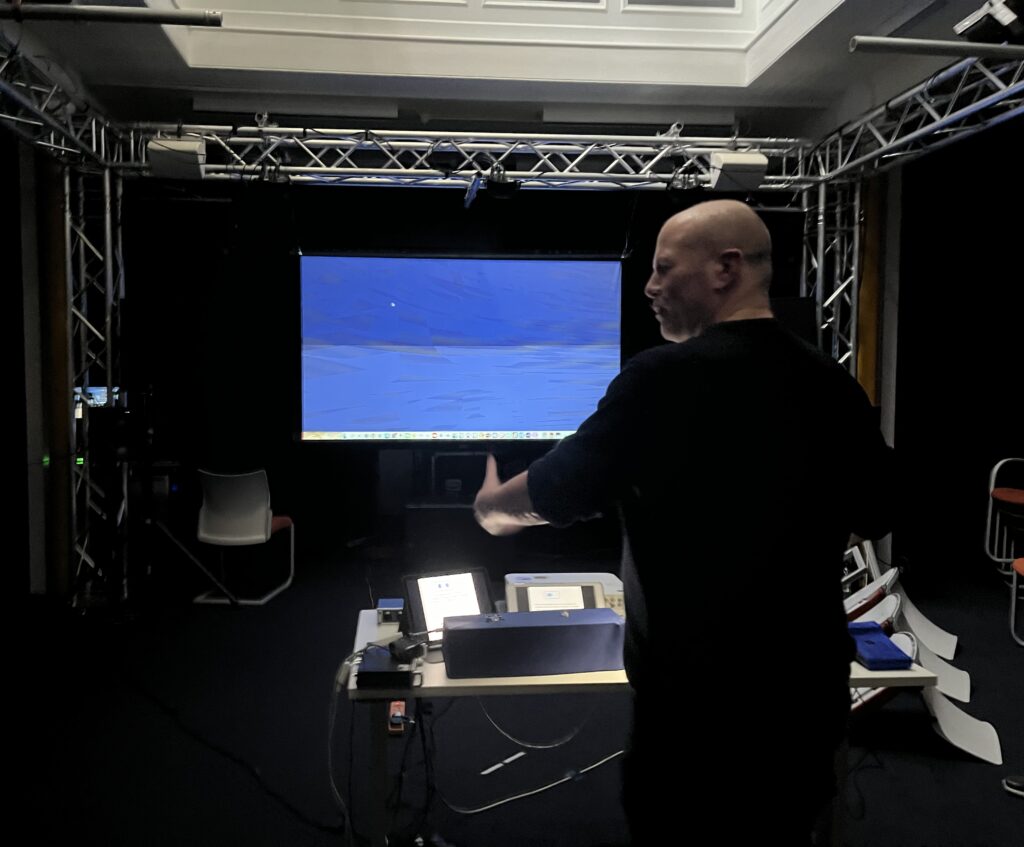
We also received some very helpful feedback on site. The first one to arrive was Jules. He experienced the entire interactive installation on his own and gave very substantive advice (see Figure 1).
Figure 1: A photo Showing Jules Giving Feedback.
The first thing is that most of our sound samples are concentrated in the same frequency band, mostly in the middle and low frequencies, resulting in the phenomenon that music and sound effects are easy to “fight” with each other, so that the two can not being well highlighted or integrated together. The solution is to replace some music and sound effects with higher frequency sounds, such as piano arpeggiated melodies or high-frequency sea monster sounds.
The second one is that it would be more immersive if we could add four speakers above to create an underwater perspective. Since our theme centered around thalassophobia, it would have been more engaging to create a deeper ocean atmosphere on site.
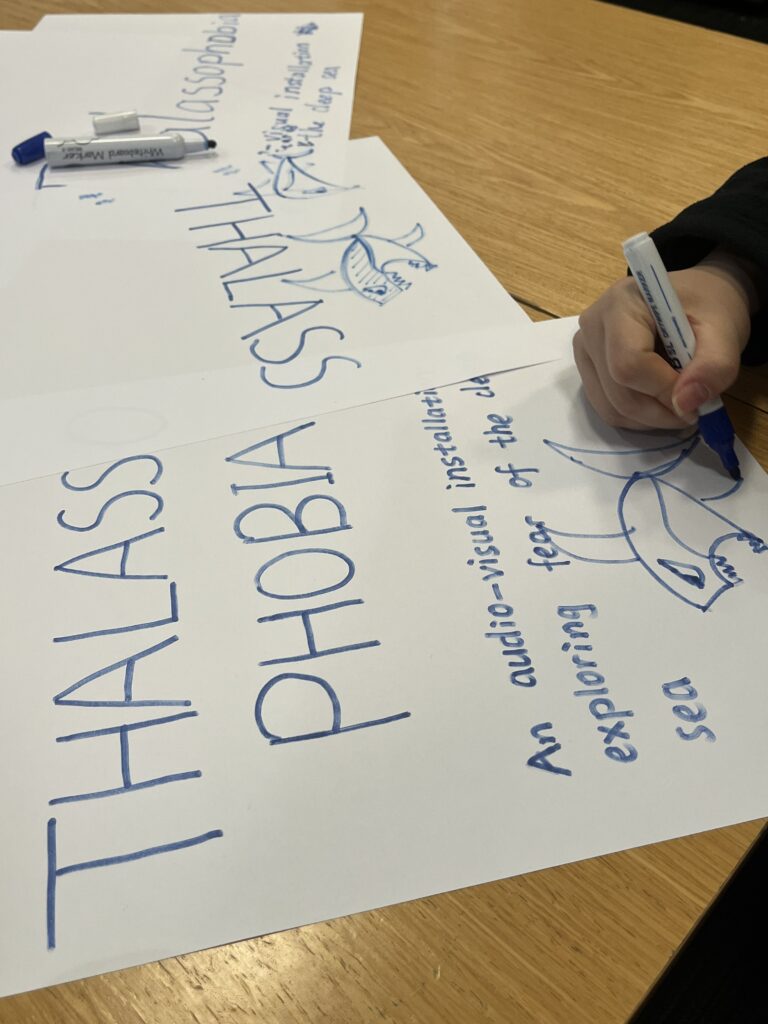
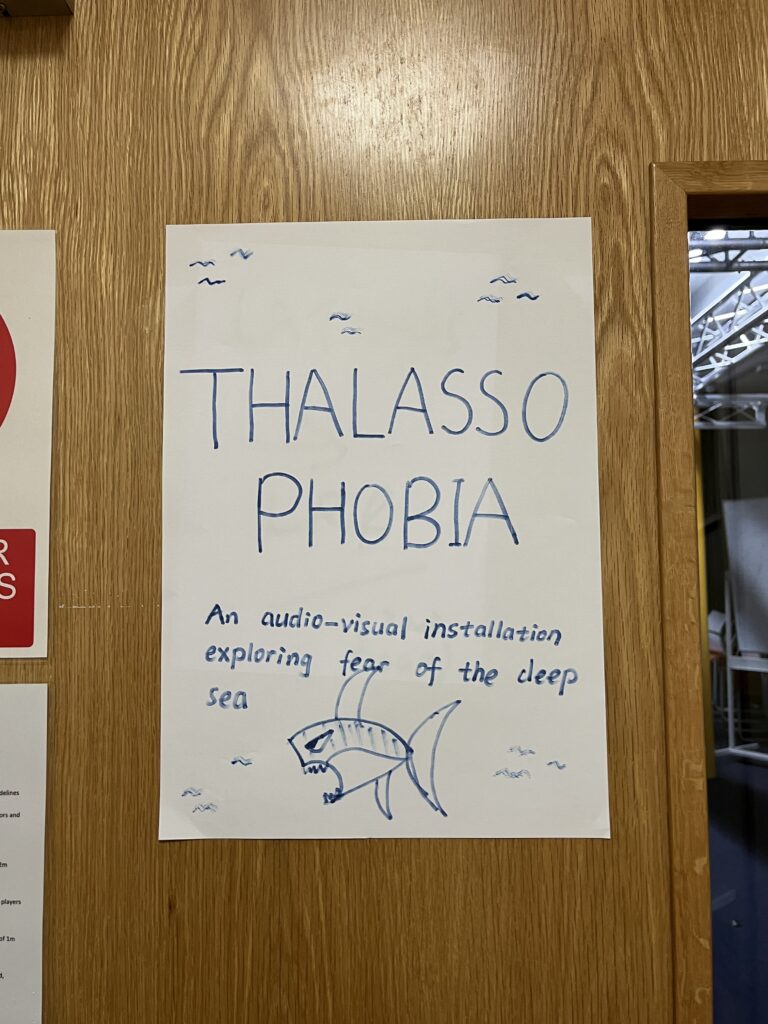
The third one is that we would better make a poster and stick it on the door outside, so that everyone can have a general understanding of our group’s installation before entering. So we drew our own cute posters and put them on the door of the Atrium (see Figure 2 and Figure 3).
Figure 2: Poster making process.
Figure 3: Poster of our group’s installation.
The last point is the placement of hardware equipment. Jules suggested placing the two sensor boxes in columns together on the table, rather than in the same horizontal row (see Figure 4). In this way, when the user controls one of the light sensors, the other light sensor can also be controlled together, so that the user can better feel the changes in sound and vision at the same time.
Figure 4: The Placement of Hardware Equipment.
During the formal presentation, a tutor made a very clever suggestion about the placement of our equipment. She suggested that we could attach the sensor usage instructions directly to the sensor boxes, so that users do not have to glance at the iPad next to them and then come back to interact with the sensor, which reduces some troublesome steps. Therefore, we wrote small notes with instructions for each sensor and posted it on the sensor boxes for the convenience of users (see Figure 5).
Figure 5: Sensor Instruction Note.
Most users found our interactive installation interesting, but the visuals could be richer and the sensor settings could be clearer. Overall it’s quite immersive. I am personally satisfied with the overall setup on site (see Figure 6). It can be easily understood by users without losing the sense of atmosphere. What we need to do now is to analyze the feedback we get in the presentation and solve the problems found. In addition, I personally think that some optimizations can be made in the software, such as making the project look more concise and clear.
Figure 6: On-site Installation Setup.
Thanks very much for everyone’s hard work during this time. Special thanks to Jules, Leo and Joe for their strong support and technical help. Thanks also to all the teachers and classmates for attending. From the prototype in the first week to the actual implementation now, I am very moved by the step-by-step efforts of our Presence group. Thanks to my group members.
In this week’s DMSP lecture, we received suggestions from teachers that we need to simply decorate hardware devices such as sensors and MIDI controllers, and hide the numerous cables to ensure aesthetics. So this week I also worked with Ruojing and Yuan to make handcrafted cases for these devices (see Video 1 and Video 2).
Video 1: A Video Showing the Sensor Decoration Production.
Video 2: A Video Showing the MIDI controller Decoration Production.
In order to comply with our theme of thalassophobia, we specially made the color of all decorations dark blue, so that users can also experience the emotion of thalassophobia from the details. During the last rehearsal we agreed that the dark blue worked well, so that was settled on as the final decoration for the hardware devices.
In addition to this, I also created instructions for sensors and MIDI controller (see Figure 1). At that time, it will be displayed on two iPad screens for users to see.
Figure 1: Instructions for Using Sensors and MIDI Controller.
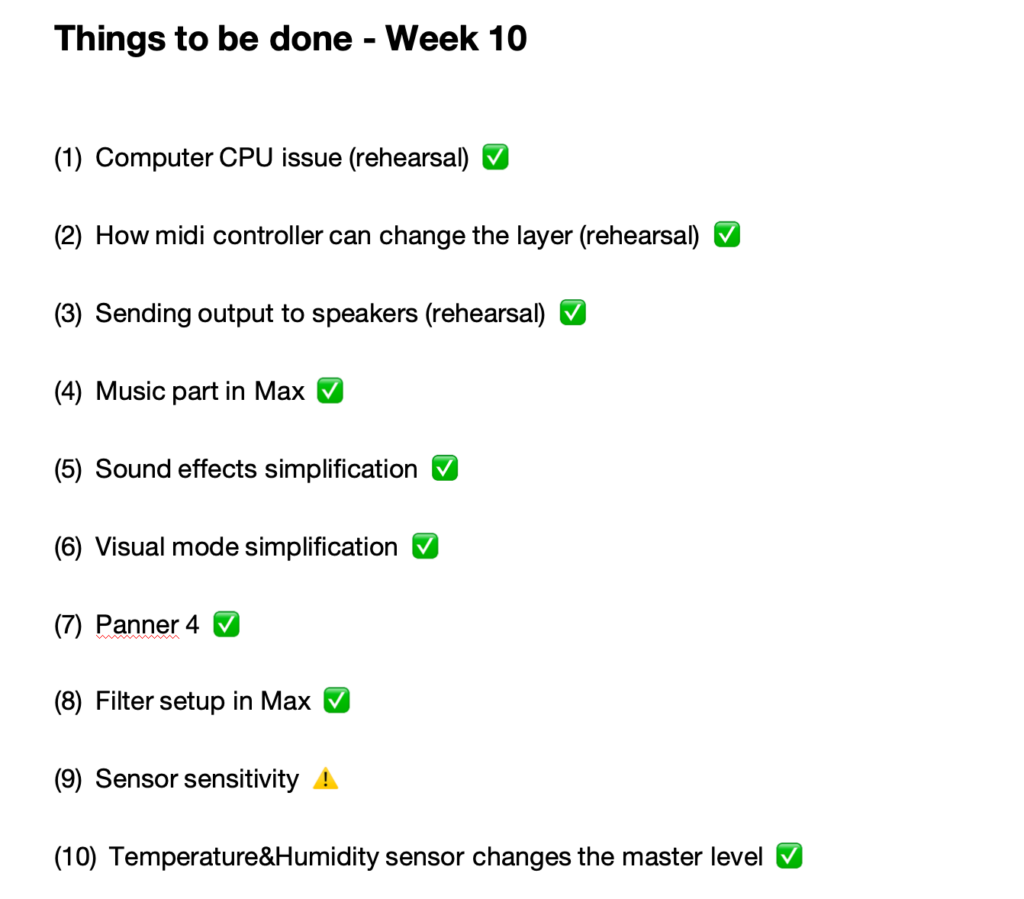
This week I mainly improve the project based on the “Things to be done” in Week 10 summarized last week. On Thursday, Leo and I had an in-depth discussion on the contents of all the software and ended up solving three problems: determining the number of panners, setting the filter in the Max patch, and using the temperature sensor to control master level.
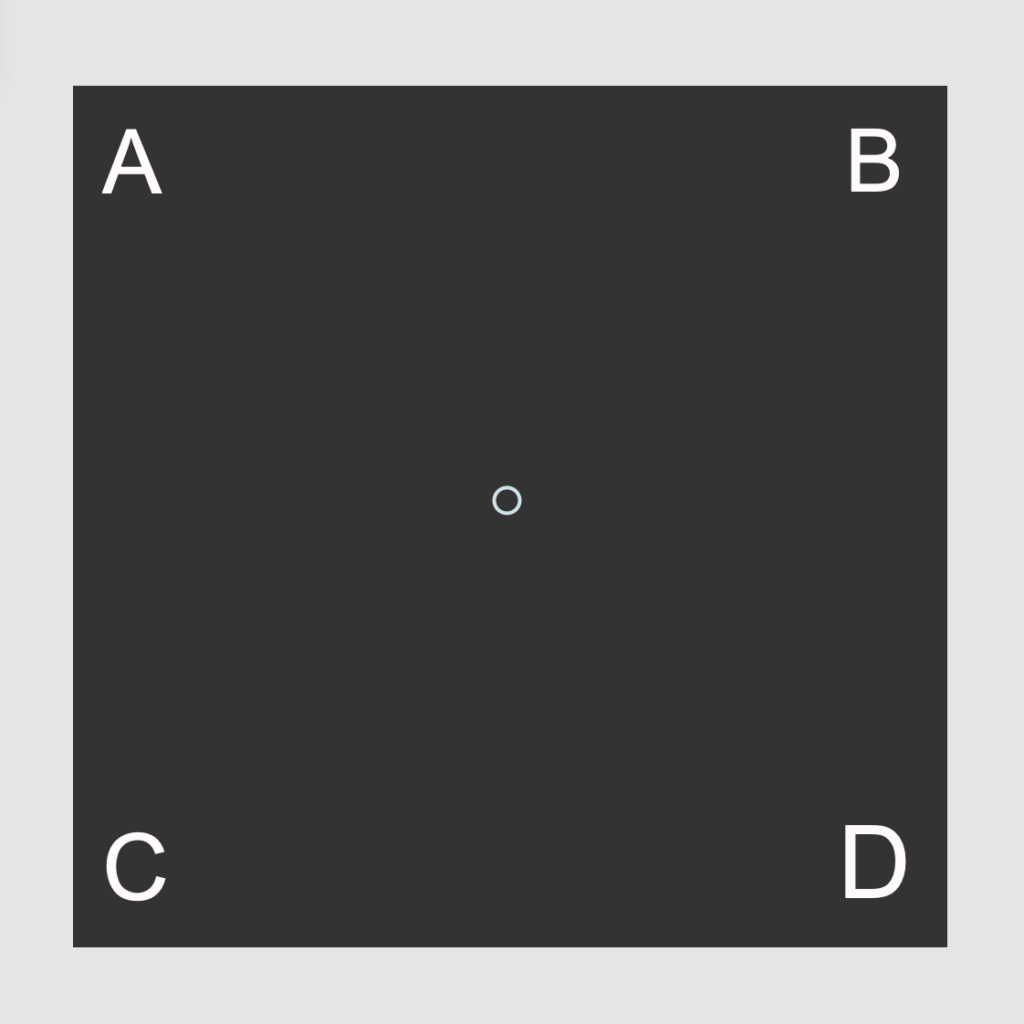
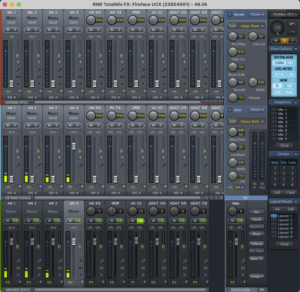
The first is the panner aspect. Given the portability and duration of our on-site setup, we found 4 speakers to be the most suitable. It can not only make the entire installation feel immersive, but also avoid problems such as errors or insufficient equipment due to over complexity to a certain extent. Correspondingly, the positions of the four speakers in the Max patch are determined as the four points A, B, C, and D of the pictslider (see Figure 1). At the same time, the settings in the Totalmix software bundled with the FireFace UCX sound card are to output the four channels to the corresponding four speakers (see Figure 2).
Figure 1: Pictslider in Max Patch.
Figure 2: Totalmix setup.
The second is the filter setting in Max. The purpose of this filter is to allow users to experience changes in sound frequency by interacting with the humidity sensor. After Leo’s guidance, I discovered that the cascade~ object can implement audio filter changes. With the filtergraph~ object, the cutoff frequency can be changed by the value received by the sensor (see Figure 3).
Figure 3: Filter Part in Max Patch.
Finally is the master level part. This extra step is taken into account that when there are more people in the environment, the sound level will correspondingly increase, which may cause some people to be unable to hear the sounds in the installation. At this time, we need to increase the overall volume to improve this. However, manual adjustments on site will greatly affect the user’s sense of immersion and personal experience. I later thought that the number of people in the environment is closely related to the temperature in the environment, so the less obvious temperature value in the temperature&humidity sensor can be used to control the master level, thus realizing the operation of adjusting the total volume invisibly according to the on-site environmental conditions. That is, the more people there are, the higher the temperature, and the greater the master level of the installation.
I had never thought of how to output four channels of sound before. Leo helped me solve this problem: dac~ object can directly output the desired number of tracks. I thought that I could use the live.gain~ object set to four channels to connect it to the panner and dac~ object to achieve master level control (see Figure 4).
Figure 4: Master Level Part in Max Patch.
This Saturday, we negotiated with other groups and successfully borrowed the right to use Atrium for two hours. So we had our last rehearsal in the Atrium (see Video 1).
Video 1: A Video Showing the Installation Setup for the Final Rehearsal.
There were no problems with hardware device connections and most software settings during the rehearsal process. However, the problem of sensor sensitivity was not successfully solved this week (see Video 2).
Video 2: A Video Showing the Sensor’s Lack of Sensitivity.
So I made an appointment with Joe to meet before the official demonstration next Wednesday to focus on the sensor sensitivity issue. Hopefully this last question before the final presentation will be ironed out next week!
This week we borrowed all the equipment needed and rehearsed together the construction and implementation of the final installation (see Video 1 and Video 2).
Video 1: A Video Showing the first rehearsal of installation.
Video 2: A Video Showing the first rehearsal of installation.
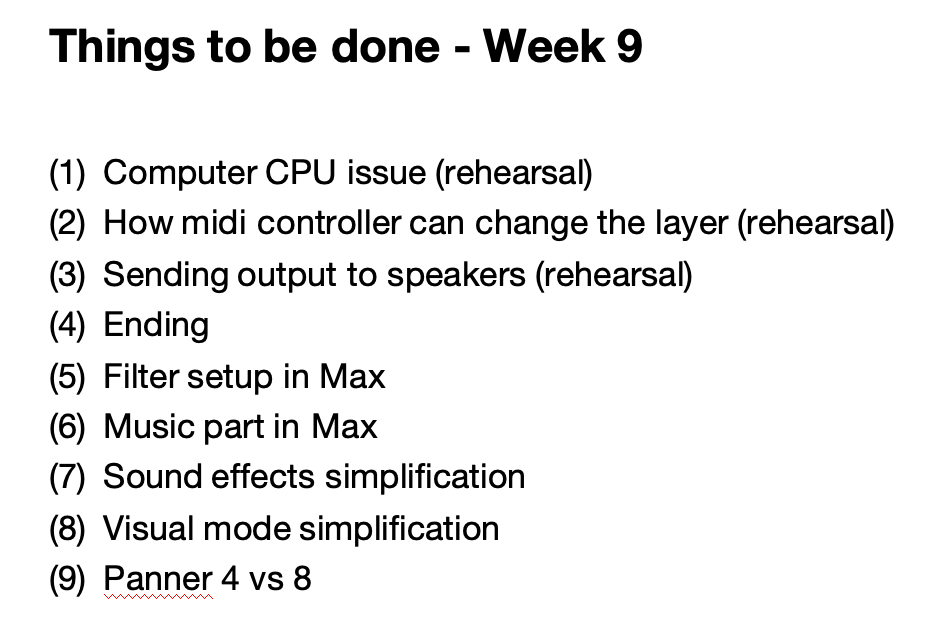
Before the rehearsal, we discussed it with Leo in the tutorial and came up with a “Things to be done” list in Week 9. This greatly helped our rehearsal process.
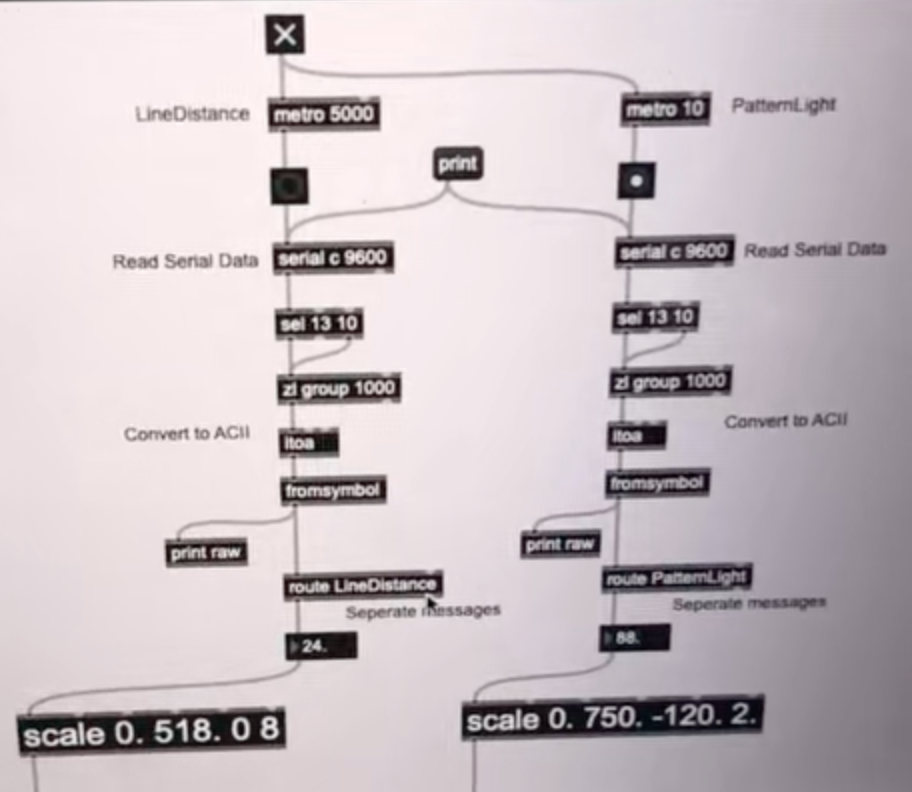
During the rehearsal, I discovered two problems with the sensor. The first one is that the value sent by one of the ultrasonic sensors to the Max patch changes very laggy, and sometimes even stops changing. As shown in the video, the message in the console is normally changing , but the LineDistance value in the float object which shows 38 stops did not change accordingly. In the rehearsal, I tried many methods and looked for possible faults in the equipment connection, the Arduino project and the Max patch, but it still stuck after modifications or restarts (see Video 3).
Video 3: A Video Showing the LineDistance Value Stop Changing in the Max Patch.
The second is that in the sound part of the Max patch, the x-axis and y-axis of the pictslider, which are controlled by the light sensor and ultrasonic sensor respectively, cannot change particularly smoothly, either too slowly or too jumpy. This may have an impact on the user’s experience in the moment when interacting with the installation. I tried changing the delay value in the Arduino project and the metro value in the Max patch, and temporarily found a few more moderate values, but the effect was still not the best. So for the control conditions of the x-axis and y-axis, I still need to try multiple methods to choose the best one.
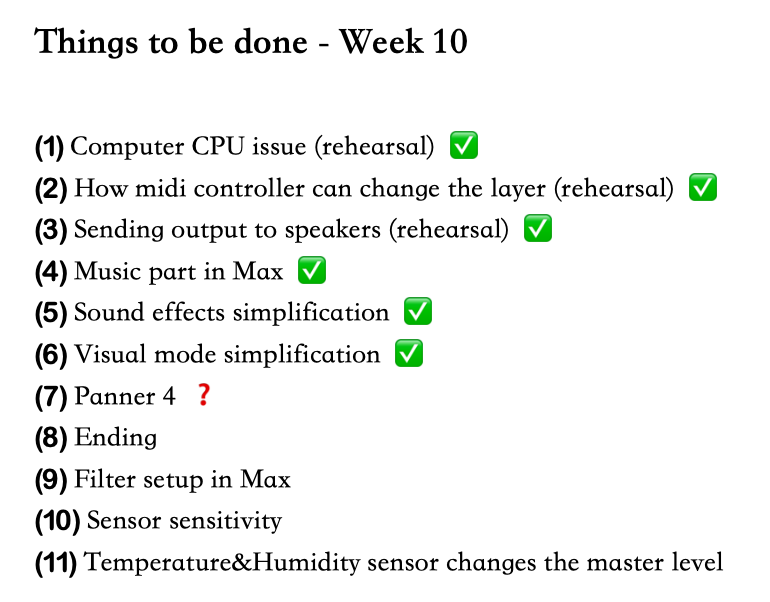
These two issues are what I need to focus on next week. At the end of the rehearsal, we summarized the things in the Week 9 list that we completed today, and based on this, we listed the new “Things to be done” in Week 10. The check marks are the parts that have been completed this week, the question mark are the part that is doubtful and need to be discussed again, and the rest are the things to focus on in Week 10.