Any views expressed within media held on this service are those of the contributors, should not be taken as approved or endorsed by the University, and do not necessarily reflect the views of the University in respect of any particular issue.

Interaction_Software

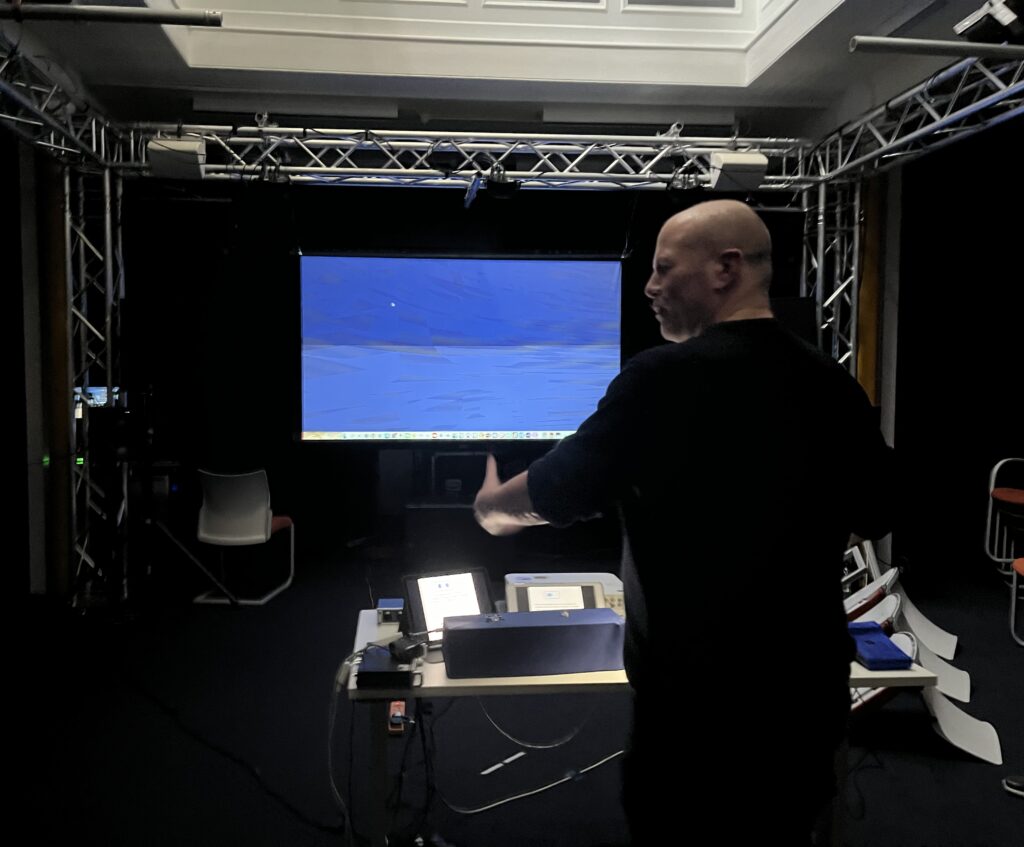
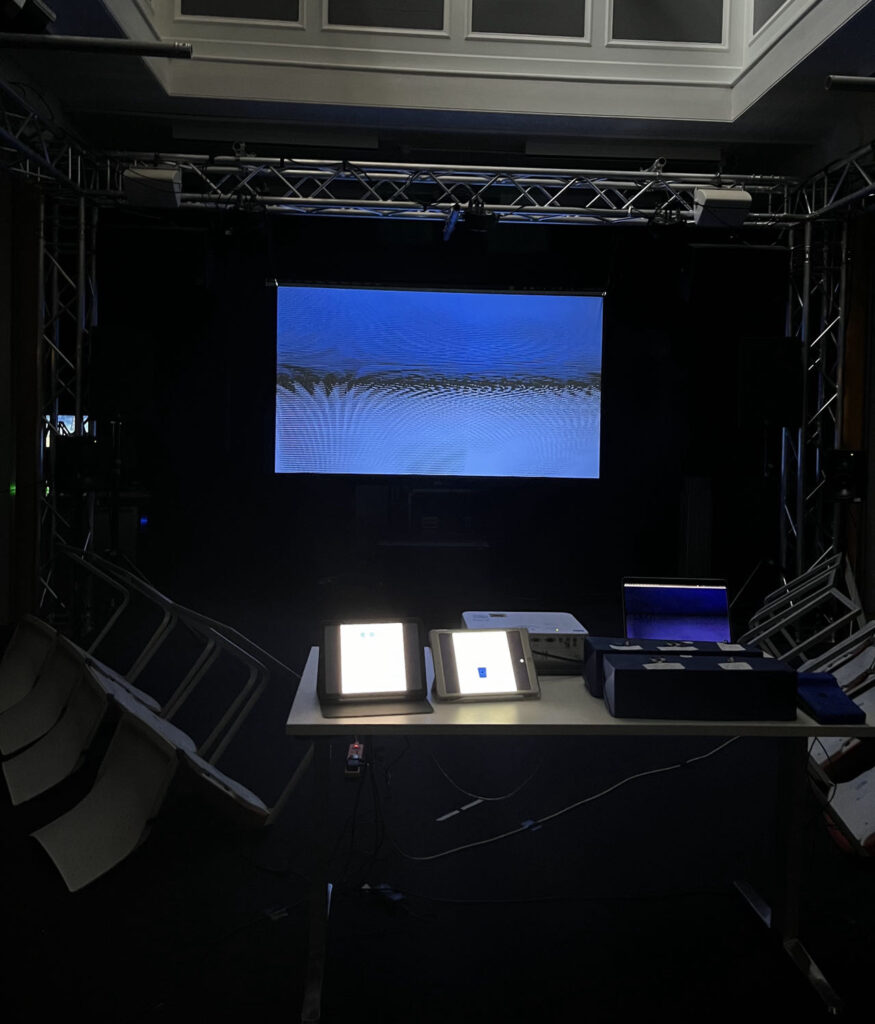
For the interactive software, I mainly use Arduino and MaxMSP (see Figure 1). Arduino is responsible for processing the information received by the sensors connected to the hardware Uno, and Max is responsible for receiving the data in the Arduino and connecting it to the Max patch for the audio and visual parts.

Figure 1: Arduino and MaxMSP Software.


Arduino

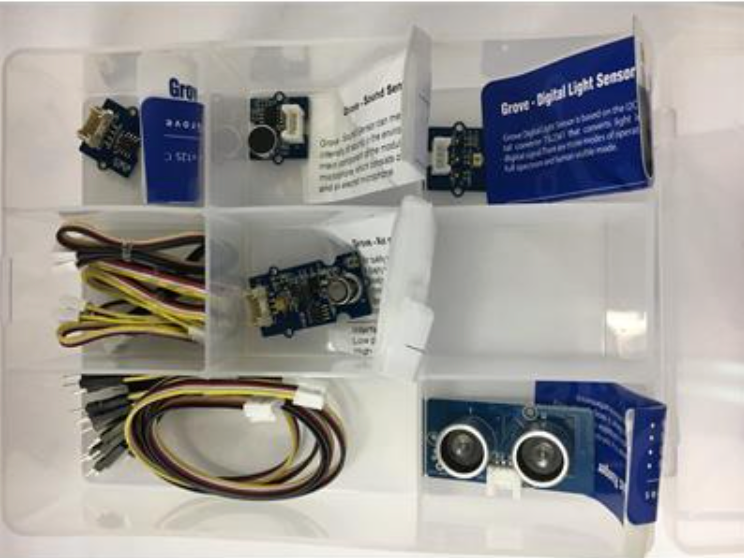
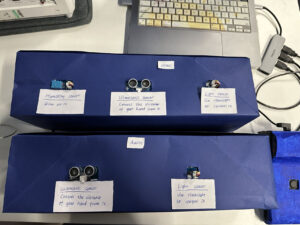
In the preliminary test, I tested the ultrasonic sensor, light sensor and temperature&humidity sensor respectively and created a separate Arduino project for each sensor.

Here are the videos and pictures of the Arduino project for each sensor.

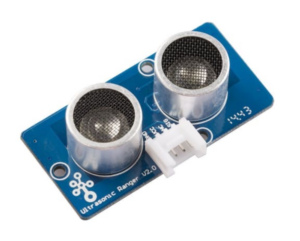
1. Ultrasonic sensor (see Video 1 and Figure 2).

Video 1: Ultrasonic Sensor Connects to Arduino.

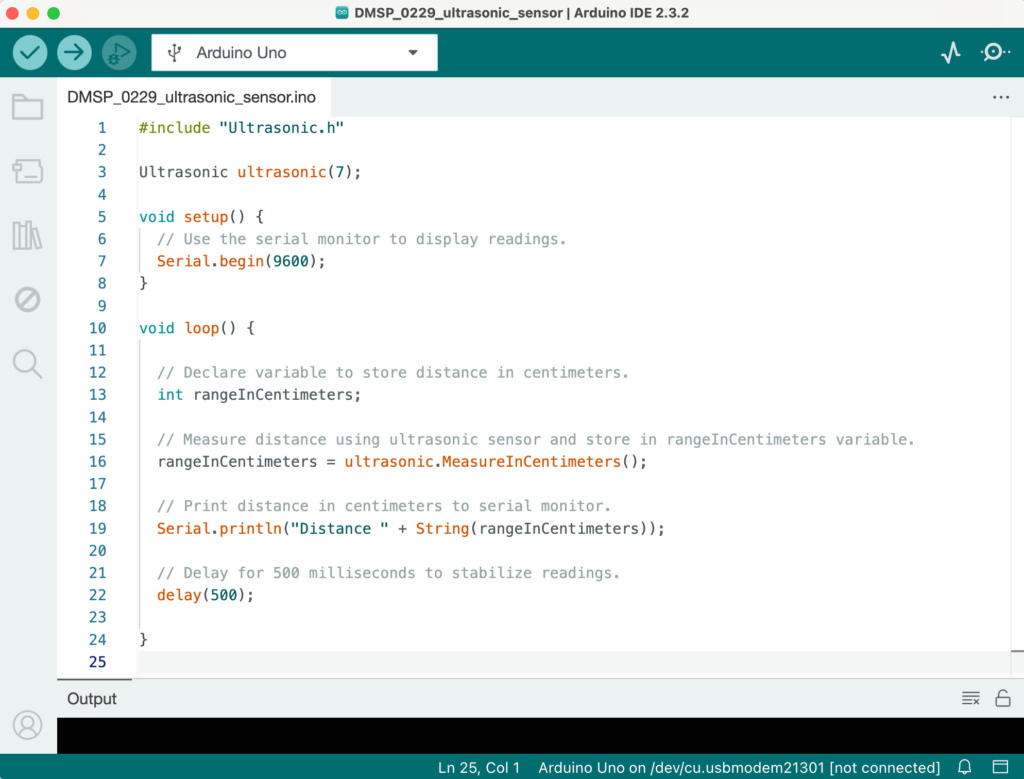
Figure 2: Ultrasonic Sensor Separate Arduino Project.

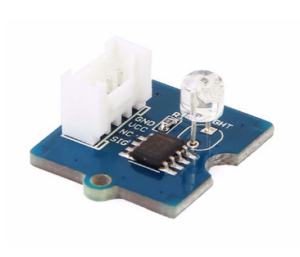
2. Light sensor (see Video 2 and Figure 3).

Video 2: Light Sensor Connects to Arduino.

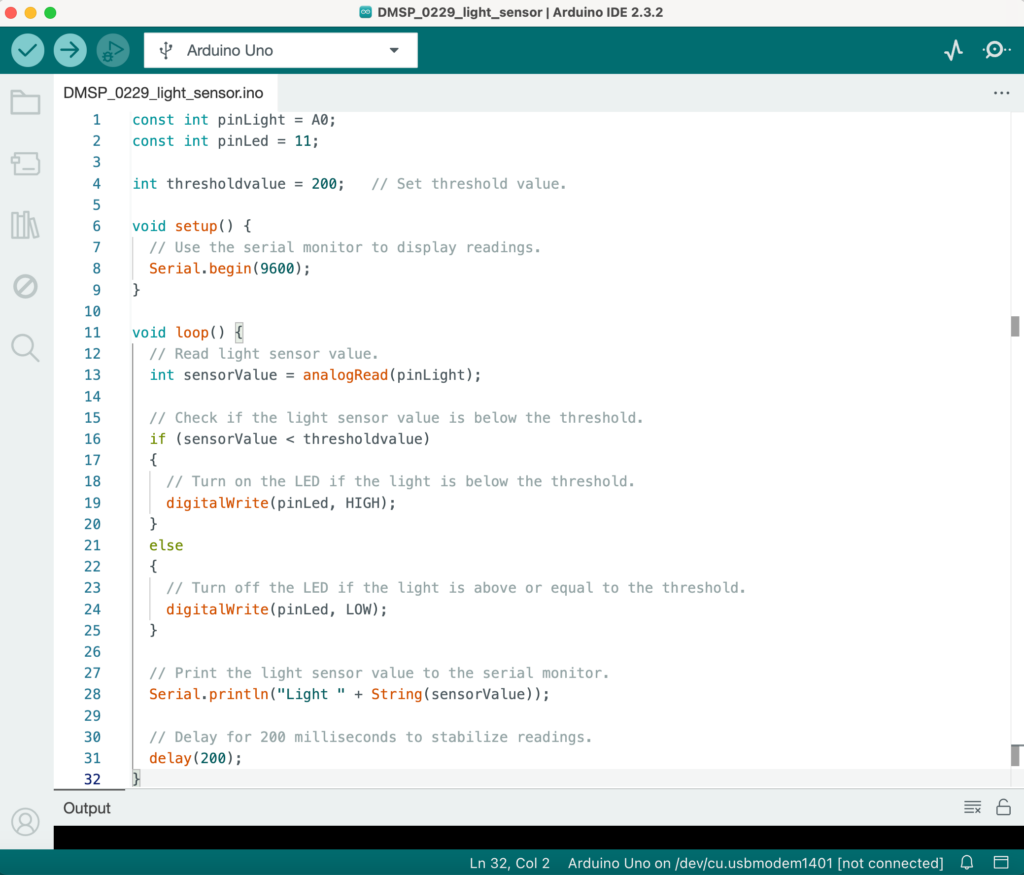
Figure 3: Light Sensor Separate Arduino Project.

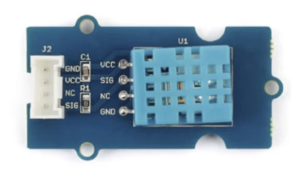
3. Temperature&Humudity sensor (see Figure 4).

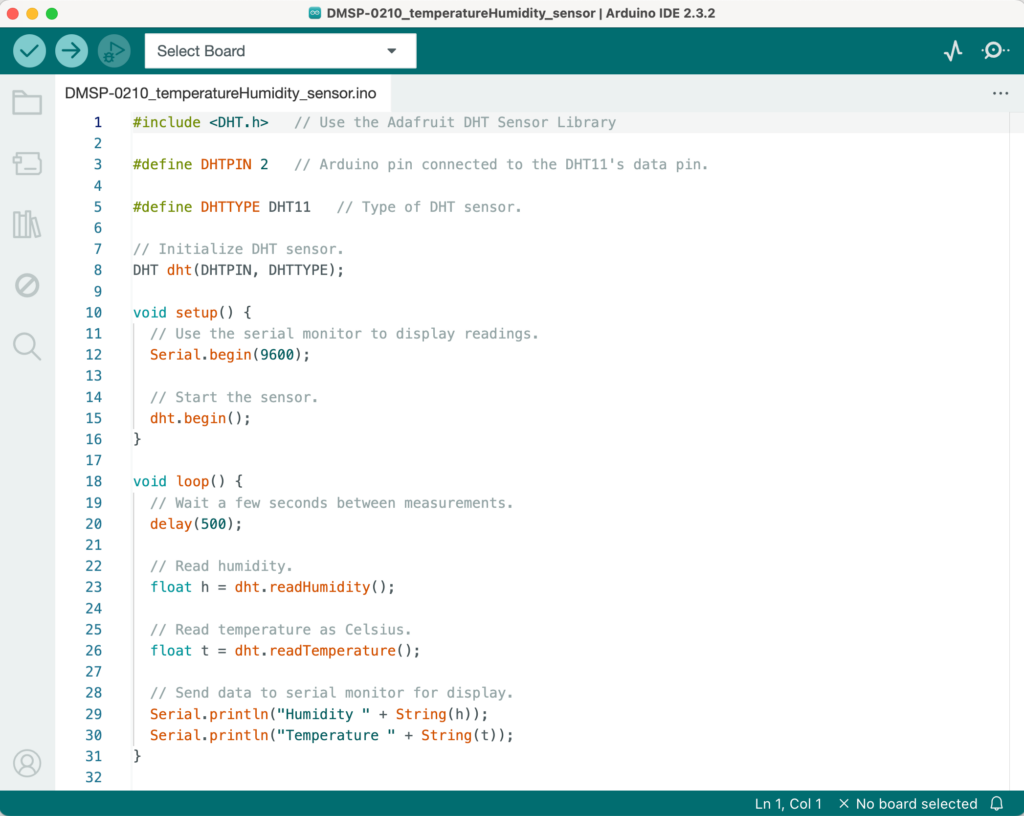
Figure 4: Temperature&Humidity Sensor Separate Arduino Project.

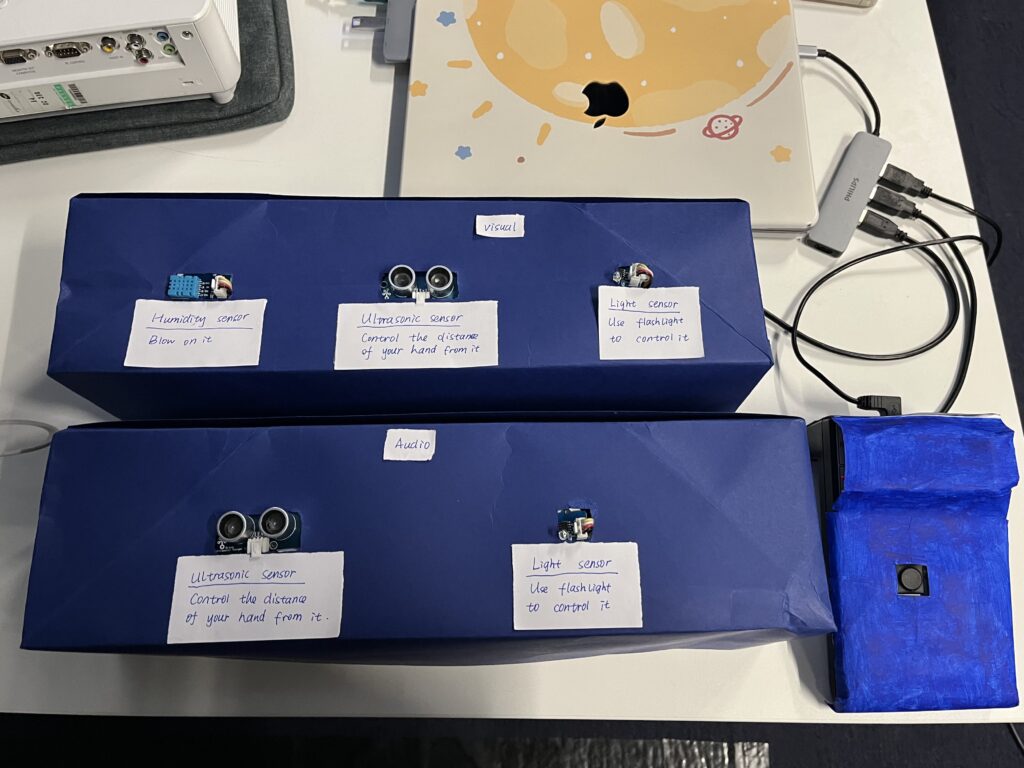
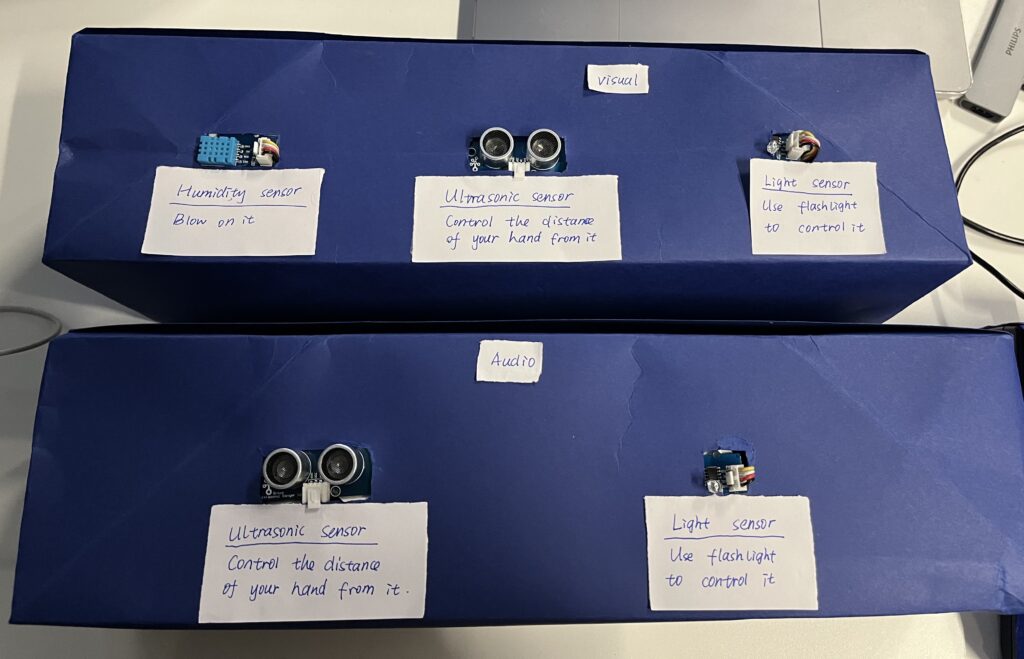
After several weeks of adjustments and optimization, I divided the 5 sensors in the Arduino project into two categories: Audio and Visual according to the on-site classification, thus forming two large Arduino projects. Here are the Arduino project files link: Arduino Project.

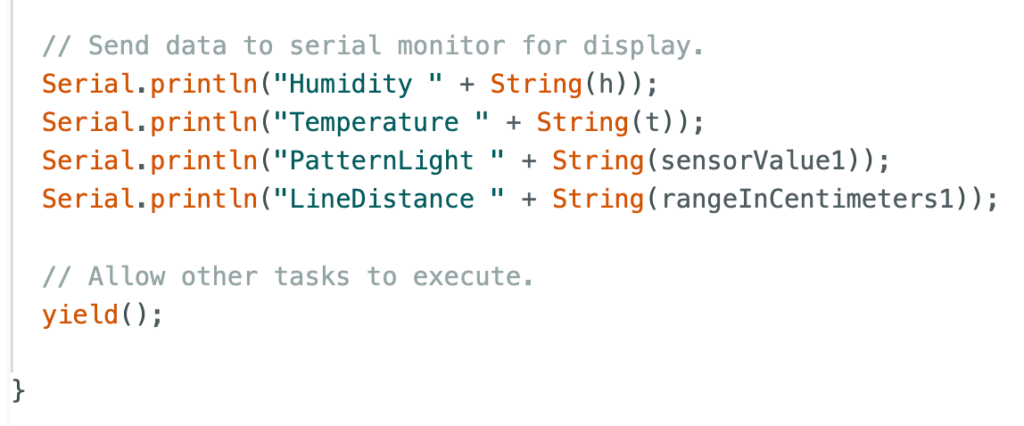
What the Visual project receives is the first ultrasonic sensor that controls pattern type changes and the first light sensor that controls pattern complexity, as well as the temperature and humidity values ​​of the temperature&humidity sensor (see Figure 5). The Audio project receives the second ultrasonic sensor that controls the x-axis of the panner and the second light sensor that controls the y-axis (see Figure 6).

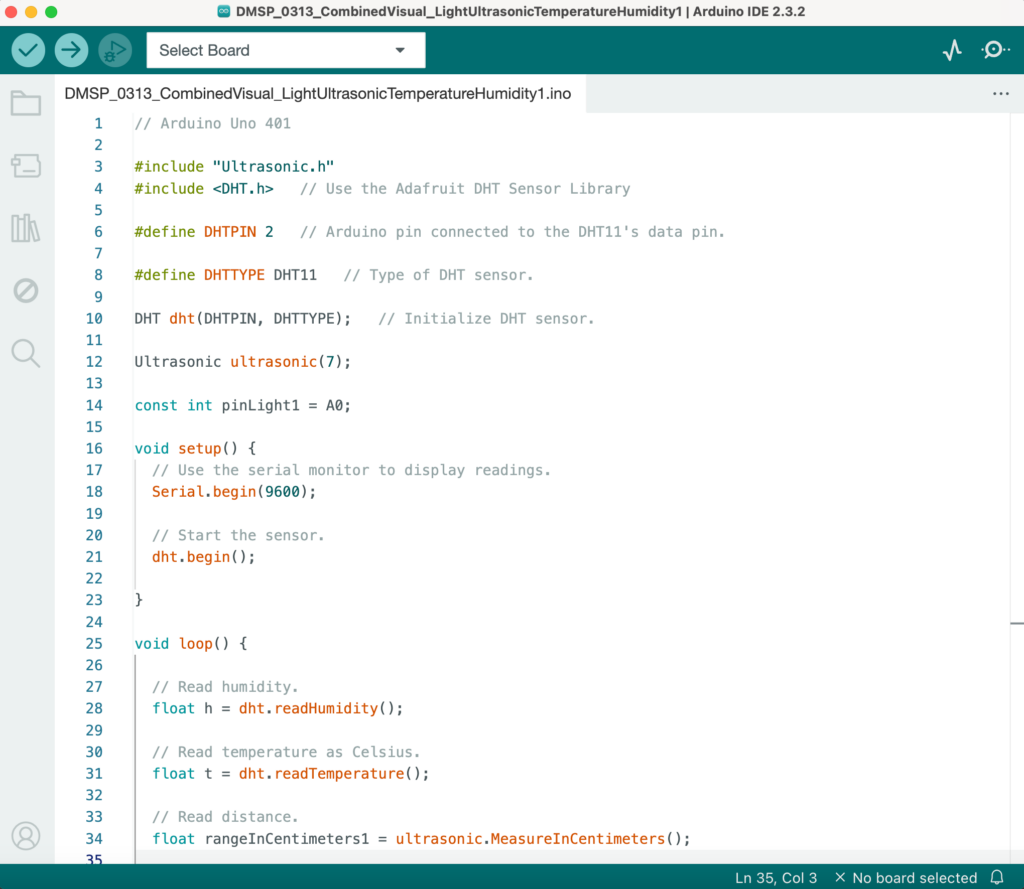
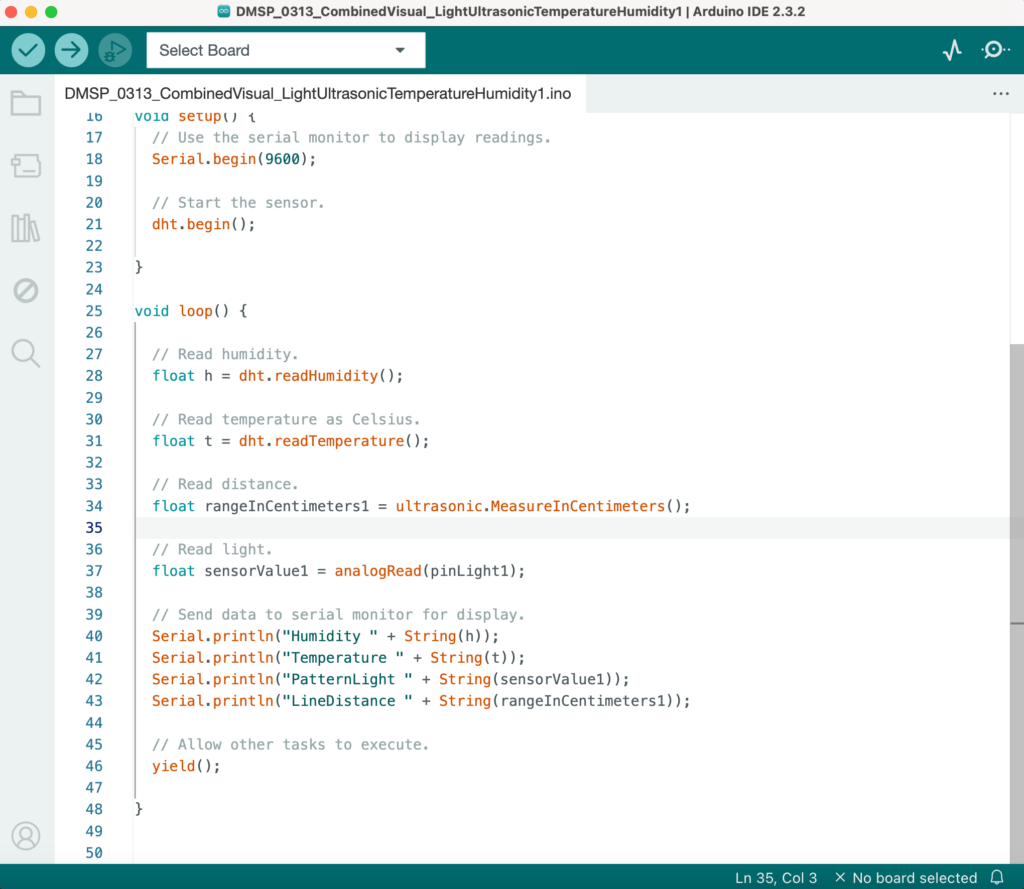
Figure 5: Arduino Project That Combines the Visual Part Sensors.

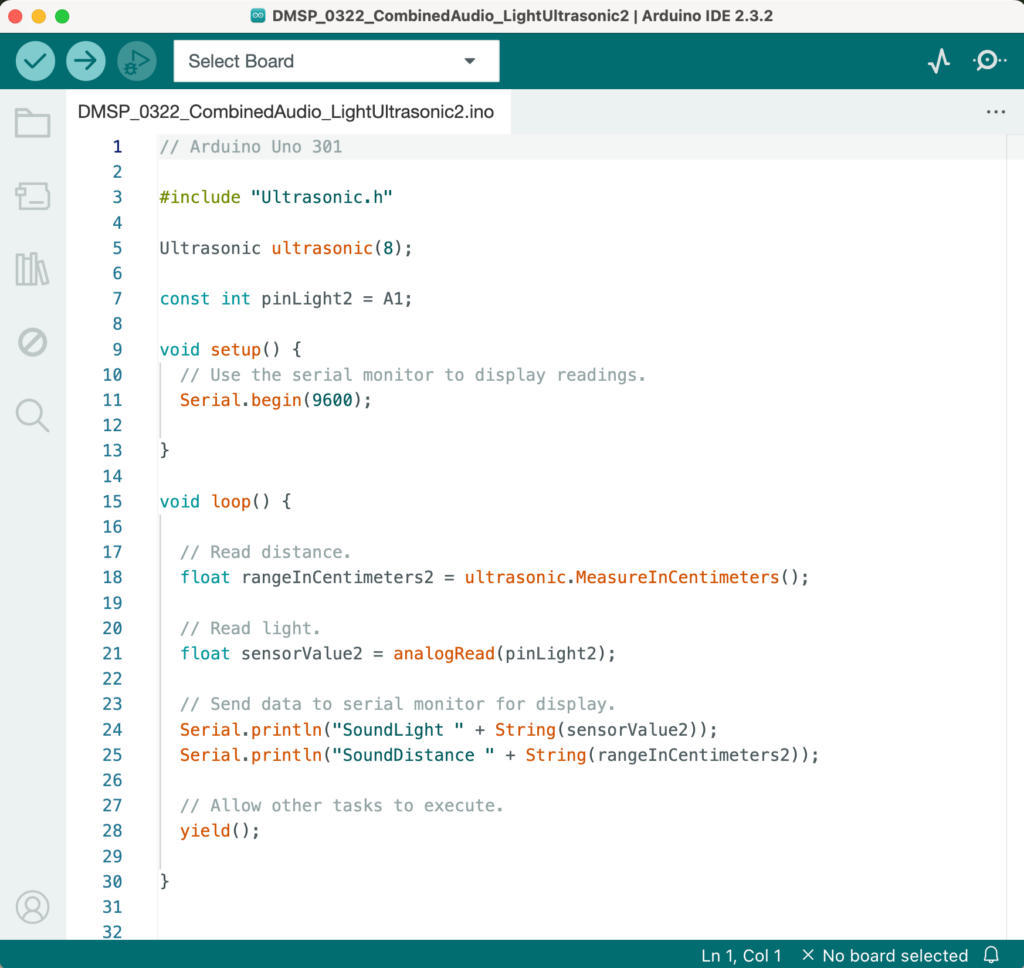
Figure 6: Arduino Project That Combines the Audio Part Sensors.

During the testing and operation of Arduino throughout the semester, I referred to a lot of relevant materials, such as the following three videos, which were of great help to my hardware and software settings.

  1. Using the HC-SR04 Ultrasonic Distance Sensor with Arduino.
  2. Light sensor Grove module.
  3. How to Use a DHT11 Humidity Sensor on the Arduino.

However, I still encountered many practical challenges and difficulties throughout the Arduino learning process. The main things that cost me a lot of thought are:

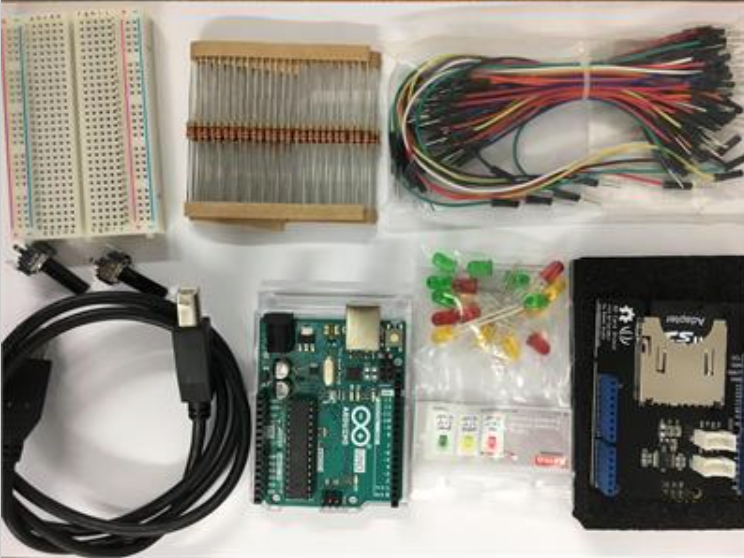
  1. How to connect multiple sensors to the same breadboard and run them successfully;
  2. How to modify the code in Arduino to increase the numerical sensitivity of the sensor;
  3. How to optimize the code in the Arduino project so that data can be sent to Max and both software can run smoothly.

After continuous research and breakthroughs and discussions with tutors, I gradually solved these difficult problems and finally got a more complete Arduino project system.


MaxMSP

The interactive part in Max is mainly the data transmission settings of sensors and MIDI controllers.

1. Sensors Part in Max.

In the sensors part, I mainly started by studying how Arduino sends data to Max. I referred to the tutorial video provided by Leo and successfully created a basic “Sending data from Arduino into Max” Max patch (see Video 3 and Figure 7).

Video 3: Sending data from Arduino into Max Tutorial.

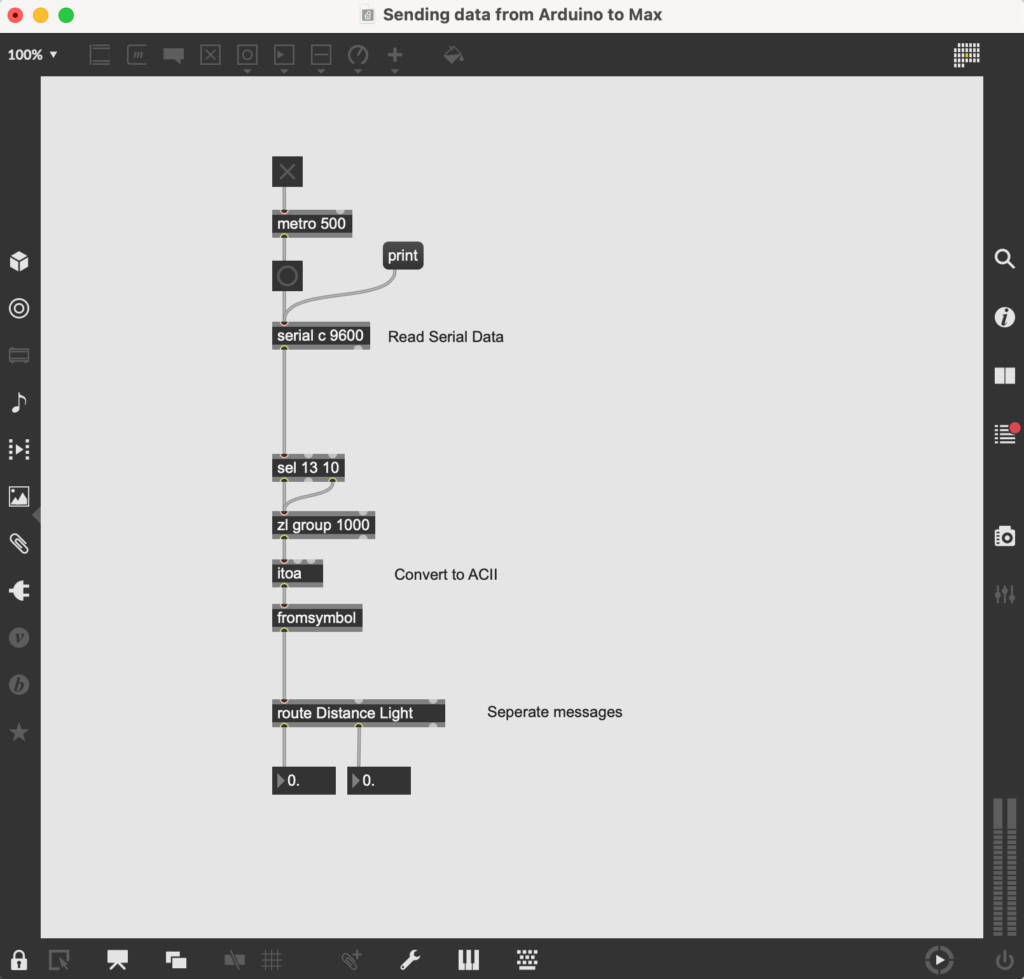
Figure 7: Sending Data From Arduino Into Max Patch.

And after that, I successfully tried running this patch using the light sensor and ultrasonic sensor (see Video 4).

Video 4: Light Sensor and Ultrasonic Sensor Sending Data to Max.

After completing these preparations, I began to formally invest in implementing the specific settings of each sensor corresponding to the specific parameters in the total Max patch. And I added objects for sending data to the visual section and audio section in the Max patch according to the determined categories. Here is the total final Max patch link: Max Patch with required audio samples.

(1) Visual Section.

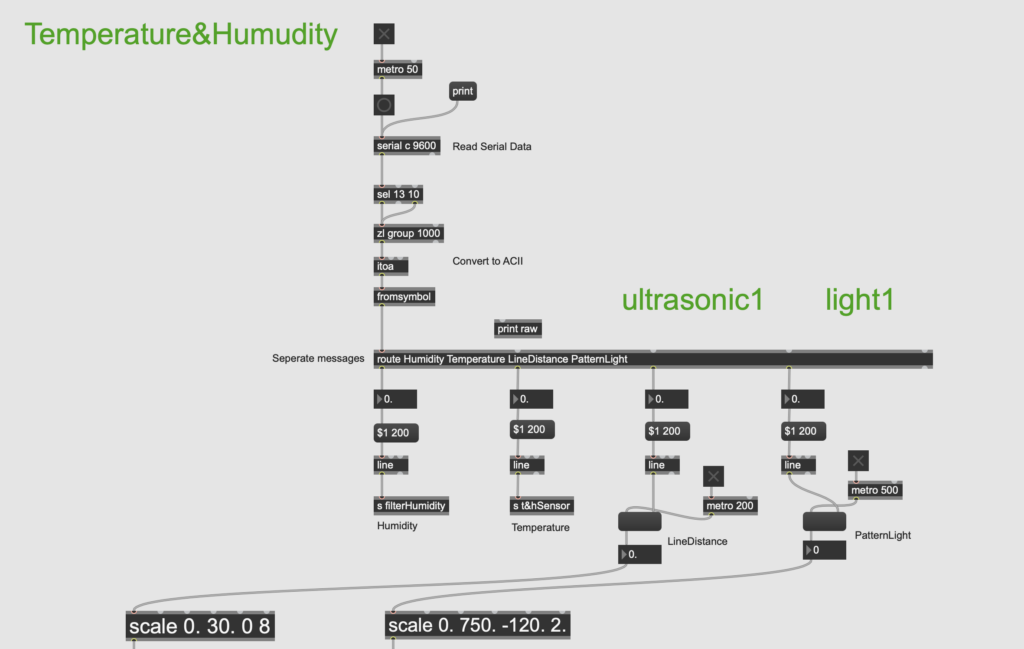
The visual section mainly uses one of the ultrasonic sensors and one of the light sensors. Since the temperature and humidity sensor is connected to the same breadboard as these two sensors, it can only be placed together in the visual section (see Figure 8).

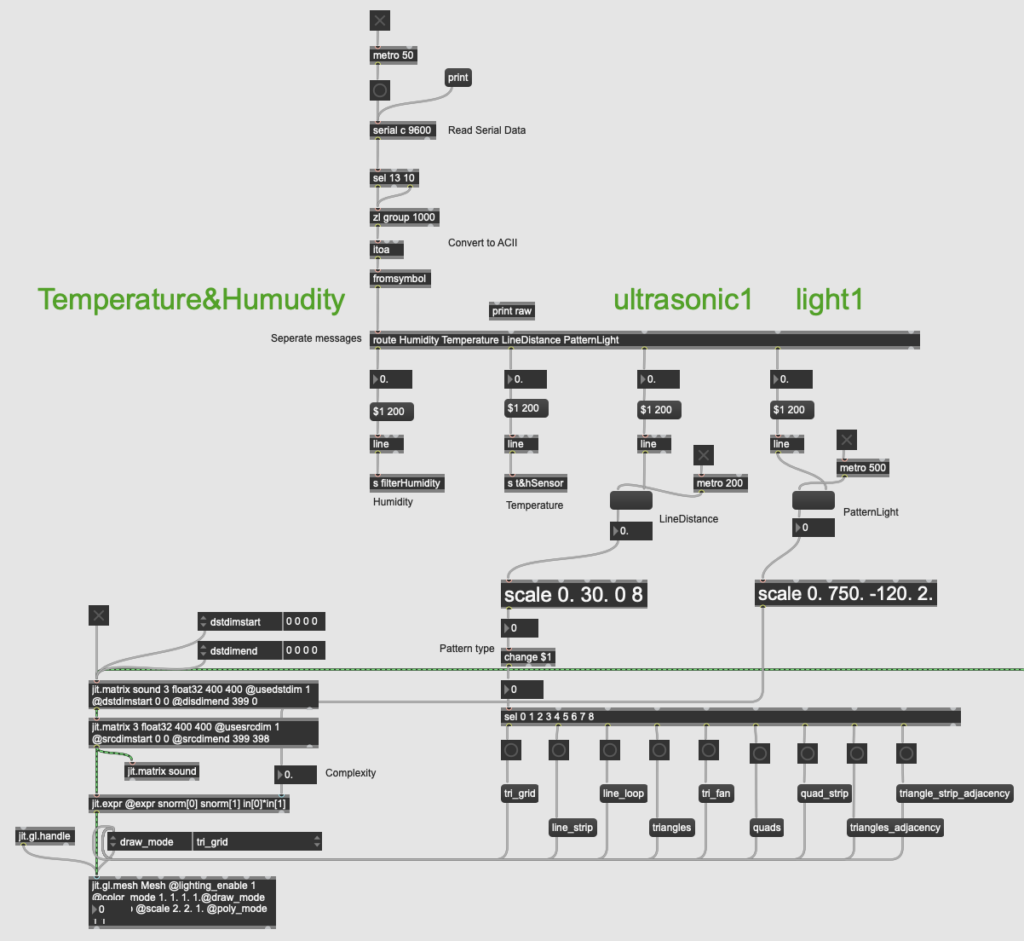
Figure 8: Sending Data from Arduino to Visual Section of Max Patch.

For the humidity and temperature values, I used send objects and receive objects to send them to the filter part and master level part respectively.

The purpose of this filter is to allow users to experience changes in sound frequency by interacting with the humidity sensor. After Leo’s guidance, I discovered that the cascade~ object can implement audio filter changes. With the filtergraph~ object, the cutoff frequency can be changed by the value received by the sensor (see Figure 9).

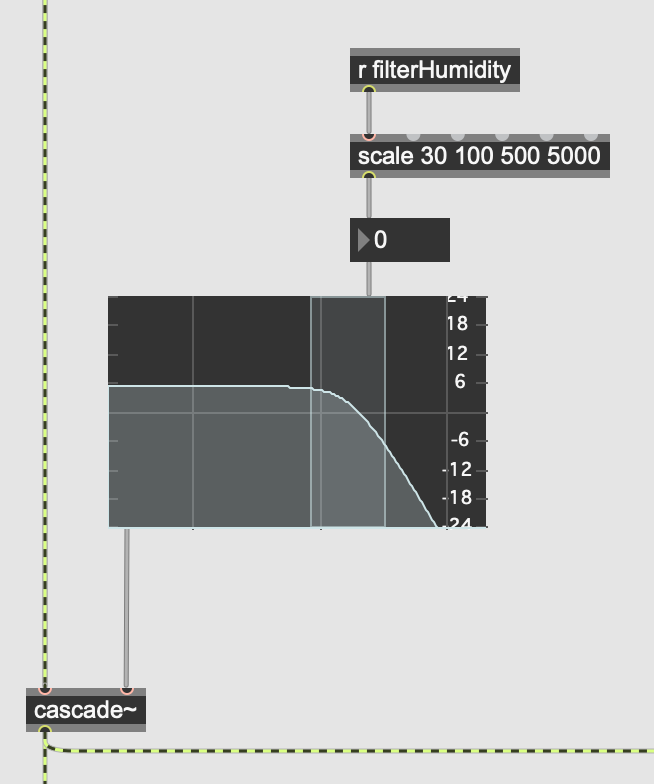
Figure 9: Filter Part in Max Patch.

The master level part is set up to avoid the phenomenon that when there are many users in the environment, they produce more sounds, resulting in some users not being able to hear the sounds emitted by the installation. So the less obvious temperature value in the temperature&humidity sensor can be used to control the master level, thus realizing the operation of adjusting the total volume invisibly according to the on-site environmental conditions. That is, the more people there are, the higher the temperature, and the greater the master sound level of the installation. Corresponding to the implementation in Max, I used the live.gain~ object set to four channels to connect it to the panner and dac~ object to achieve master level control (see Figure 10).

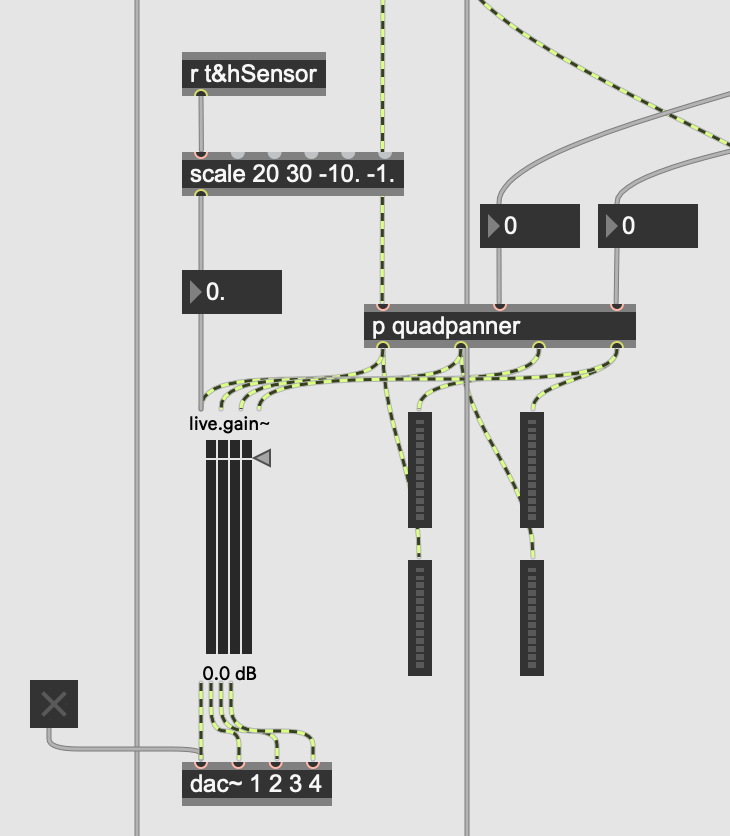
Figure 10: Master Level Part in Max Patch.

(2) Audio Section.

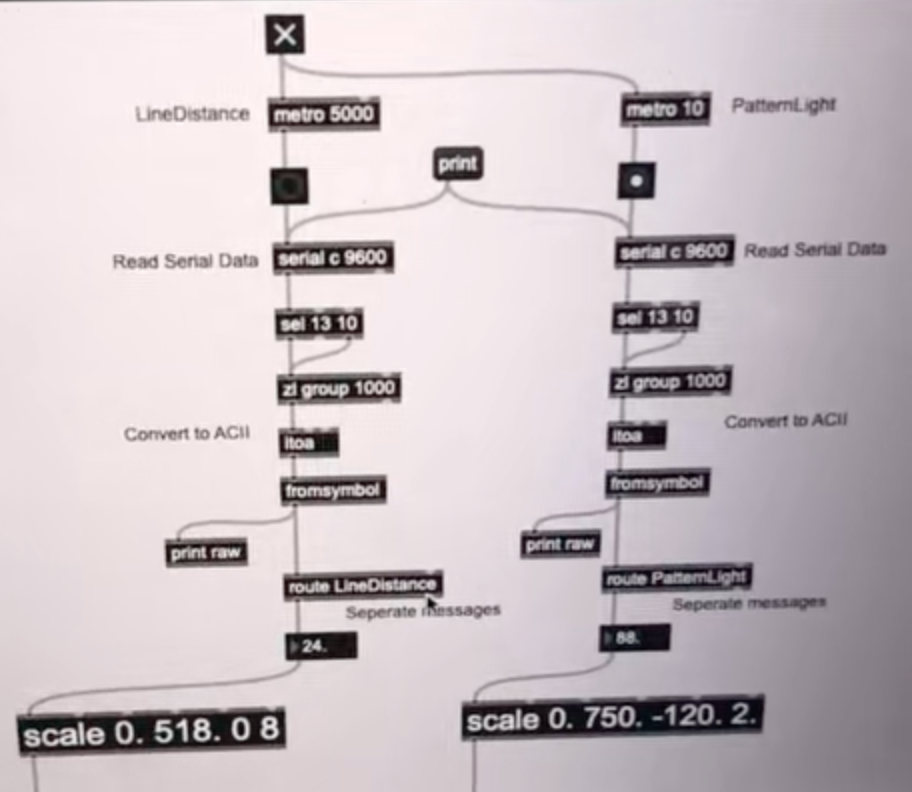
The audio section mainly uses the remaining ultrasonic sensor and the remaining light sensor (see Figure 11).

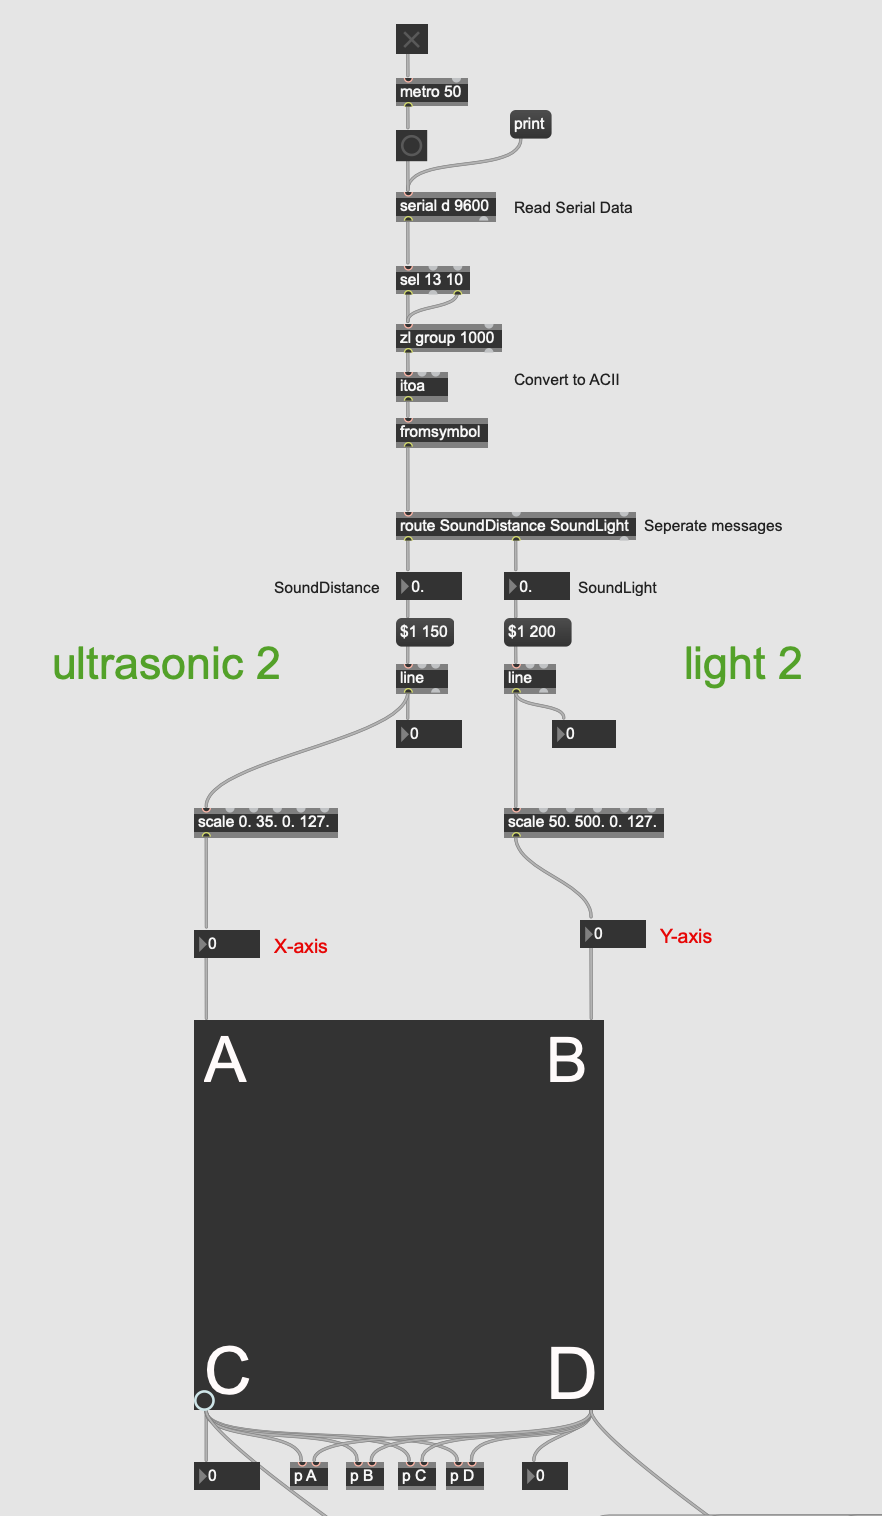
Figure 11: Sending Data from Arduino to Audio Section of Max Patch.

As can be seen from the figures above, I added a scale object after the value received by each sensor to convert it to the applicable range of each parameter. And I also added line objects in front of some parameters and set appropriate metro values ​​for them, so that the value changes more smoothly without lag.


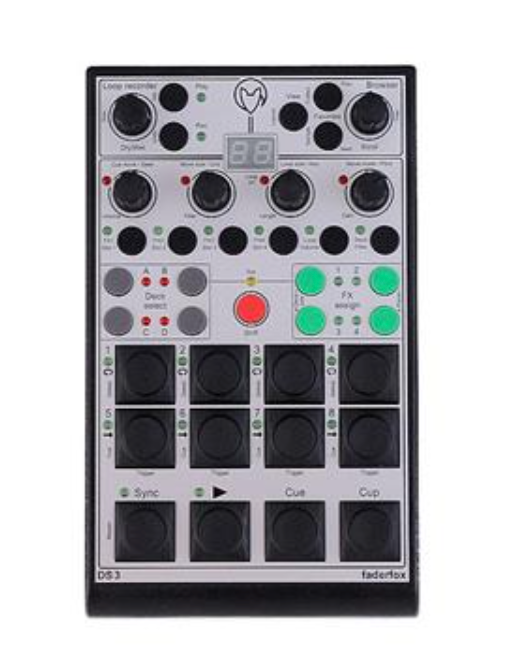
2. MIDI Controller Part in Max.

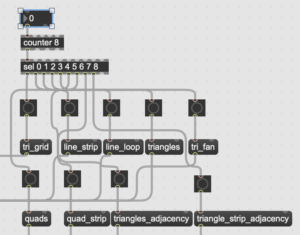
The role of the MIDI controller in our project is as a button for switching layers. During the rehearsal, I tested that the button on the MIDI controller we wanted to use had a corresponding value of 67 in Max, so I used the select object after notein object to select this value (see Figure 12).

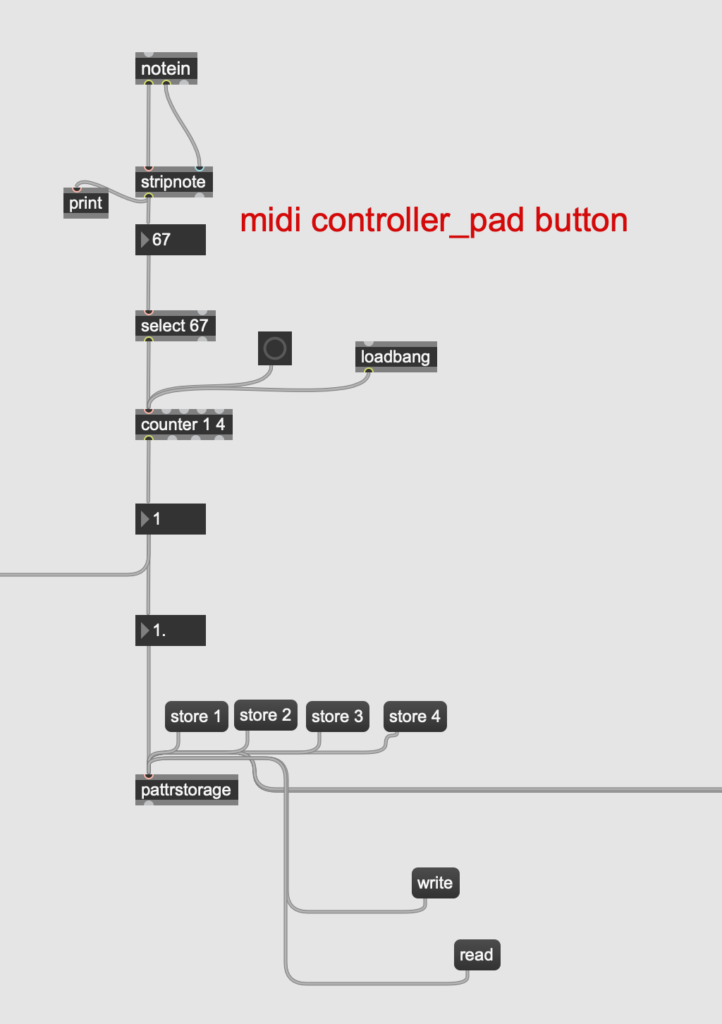
Figure 12: MIDI Controller Part in Max Patch.

However, I actually encountered difficulties during the setup process. After connecting all the objects at the beginning, I found that when I pressed the button once, the counter would count twice. Later I found out that it was because Max received the value 67 twice when I pressed the button and released the button. But what I wanted is that Max only receives the value when the button is pressed. So I sought Leo’s help, and he guided me to add a stripnote object after the notein, which can filter out the note-off information and leave only the note-on information, achieving the effect I wanted.

The final effect is that when the user presses this button, Max will receive an input of 67 values, so that the counter counts up once to achieve the purpose of switching to the next layer.


Feedback and Reflection

I received a lot of feedback on site and had some personal reflections after the final presentation. Here are the detailed descriptions: Feedback and Reflection


Interaction_Hardware

Sensor Category

In the first half of the semester, I tried many kinds of sensors in the Grove sensor kit, such as light sensor, sound sensor, air quality sensor, etc. But then it turned out that some of the sensors did not work with our installation. For example, the sound sensor needs to receive sounds above a certain sound pressure level before it changes its value. However, our project is an immersive audio-visual installation. If users keep making sounds to interact with the sound sensor, first of all, it will affect the immersion. Secondly, the sound sensor itself will also receive the sound in the installation, thus reducing the user’s interactivity. Therefore, after constant attempts, I finally chose 2 ultrasonic sensors, 2 light sensors and a temperature&humidity sensor that have obvious numerical changes and are very suitable for our installation.

Among them, the ultrasonic sensor and light sensor are more convenient to operate. Their easy-to-operate feature is very suitable for parameters that require obvious changes. So I used them together to change the sound panning and visual parts.

The ultrasonic sensor changes the value generated by the change in the distance between the object and it (see Figure 1). Users can interact with it by moving their hands closer or farther away from it to change the distance to it. The greater the distance, the greater the value it generates, and vice versa. Generally, the distance range that it can receive in real time is between 0 and 500, but the actual more sensitive part when people interact with it is between 0 and 50. I use it as a controller to change the X-axis value of the sound and music panner and change the visual pattern types.

Figure 1: Ultrasonic Sensor.

The light sensor changes the generated value based on the different brightness received (see Figure 2). Users can use the flashlight in the mobile phone to shine on it to control its numerical changes. The greater the brightness, the higher the value, and vice versa. Usually the range of values ​​is approximately between 0 and 750. So corresponding to the ultrasonic sensor, I use it to control the Y-axis value of the panner for sound and music and the complexity value of the visual pattern.

Figure 2: Light Sensor.

The temperature&humidity sensor can receive two values ​​​​of temperature and humidity (see Figure 3). Users can change its value by heating it with their hands or blowing on it.

Figure 3: Temperature&Humidity Sensor.

Similarly, the higher the temperature or humidity received, the greater the corresponding value. But what is special is that the temperature usually changes slowly, ranging between 23 and 28; while the humidity changes quickly and in a large range, usually between 35 and 100. So I used the temperature and humidity values ​​to control two different types of parameters respectively.

Temperature value is used to invisibly control the overall volume of the installation. Because sound levels increase when there are more people in the environment, this may result in some people not being able to hear the sound in the installation. The characteristic of not changing significantly in temperature is suitable for improving this. That is, the more people there are, the higher the temperature, and the greater the master sound level of the installation.

The humidity value that changes significantly is used to control the cutoff frequency of the sound filter. Obvious filter changes are very helpful to enhance interest.

Setup

On site, our interactive devices are placed on a table in the middle of the Atrium (see Figure 4). Users need to walk up to the table to interact with the installation. With four speakers placed around it, users can feel an immersive experience in the center.

Figure 4: Location of Tables for Interactive Media.

The placement on the table is based on Jules’ suggestion, placing the two sensor boxes, Audio and Visual, in columns so that the sound and visual sensors could be interacted with at the same time, strengthening the connection between audio and vision. The MIDI controller is placed on the right side of the sensor to facilitate users to switch to the next layer (see Figure 5).

Figure 5: The Placement of Interactive Media.


Interaction_Concept

Interactive Form

The form of the project our group wants to create is an immersive interactive installation. In the process of formulating the preliminary plan, I found several past cases for reference, in which the interactive part was relatively similar to my idea of ​​the interactive part of our installation.

  • Reference Art Works
  1. Wishing Wall
  2. Audiovisual Environment Suite
  3. Wu Kingdom Helv Relics Museum
Interactive Media

Interaction is one of the most important part of our group’s project. It determines the integrity, user experience and interest of the entire installation. So among various interactive media, based on controllability and innovation, I finally chose the Grove sensor and Arduino Uno (see Figure 1 and Figure 2).  Additionally, we need a “button” for switching levels. Considering simplicity and ease of placement, we chose the Faderfox-DS3, a small MIDI controller, as this button (see Figure 3).

Figure 1: Grove Sensor Kit.

Figure 2: Arduino Uno Kit.

Figure 3: MIDI Controller as Button.

Visual_Art Concept

Topic ideas and references

We are the presence group. At the beginning, our group thought a lot of topics, including emotional changes and psychological changes to express the existence and feelings of the spiritual level. At the same time, we also thought of natural themes such as seasonal changes and weather changes to express the existence and somatosensory feeling of the physical level. The spiritual level is more subjective.On the physical level, it is too vague.

Therefore, we want to combine these two feelings and have determined the final theme- Thalassophobia, which combines the natural ocean and the fear that is inspired by the sea.

I found some works by many interaction designers who work on emotions and natural environment as my visual reference.These works include the visual presentation of particles and lines, as well as the operation form of gesture interaction, which constitutes my initial idea of the final presentation of our project works.But I have to admit that my artistic ideas are limited by my technical abilities.

This video is about particle imaging of whales in digital media studio Bleeeeta:

The following pictures are The Folded Starry Sky interactive audio-visual performance created by interaction designer_ Ma ShiHua in China.


The following picture is Gesture interaction for order in chaotic words


Project visual communication

Draw_mode

Our works contain four different levels of emotions:

  1. To hear the sound of sea monsters approaching
  2. The sense of chaotic and confusion caused by fear of the ocean
  3. The third is the fear of escaping into the unknown after chaos
  4. The peace and calm left to people’s imagination.

Line particles can express our fear of the ocean concisely, and I set up different pattern changes to reflect the expression of these four emotions.There are some draw modes in my patch. Here are some pictures and lines of different modes.

tri_grid(sea creature) & triangles_adjacency(chaotic)


triangles_strip_adjacency(unknown wave) & line_strip(calm peaceful)


Interactive method

Considering that we need to do gesture interaction, my visual effect part gives some variable parameters to the sensor as artificially controllable parameters.

These videos are the visual effects produced by direct regulation on my patch.

You can see in the video that I adjusted the draw_mode to change the patterns and one of the Number Objects to control the scaling strength of the lines.As shown in the figures:

Regulating line density:

Make the names of different modes in draw mode into remote controllers.

What I neglected is that it is sensitive to directly control the pattern change in patch, and even the line change is more diverse.In live performance, the pattern change is very rigid and does not give the audience a visual impact, which may be related to the sensitivity of the sensor. It seems that the signal transmitted to max by people through the sensor as a medium is gradually decreasing.

This is a video material recorded on the spot:

Improvement suggestions

During the live demonstration of the project, I communicated with some teachers, and they gave me some valuable suggestions on visual performance.

“The pattern transformation of the video is very abstract, but it can also be a little more narrative. For example, the pattern that increases the intention of falling quickly indicates that the player falls into the ocean and highlights the fear.”

I understand why the teacher made such a suggestion. At least compared with the visual effects of these visual concepts I made in the early stage, the visual effects of live performances did not meet my inner expectations.


Visual_Technical Concept

Deconstruction of visual part patch

First of all, we have to say that we are a professional group of all-sound, so we are a weak link in visual effect, and there is no fancy design. But based on my desire to try the visual aspect, I am responsible for the conception and idea of the visual part of the project.

Because we have some experience in using max for live, after discussing the original artistic concept of our group, I thought of using jitter to realize it. This can not only play our role as a sound designer, but also make the sound visual, which is very appropriate for our own professional development.

This is my primary idea—Use the imported sound to trigger the visual system to play, and then control some parameters of the sound to make the visual patterns more diverse.

In short, after the audio signal is received, it is converted into a matrix signal that can be used for images. The matrix signal is attached to the mesh, so that the change of audio can drive the change of x_y_z axis of the mesh. At the video signal sending end, the visual presentation after receiving the signal can be seen through the jit.window.

The picture is a patch annotation diagram about three-dimensional visualisation of sound.

The following is a link to the patch:https://www.dropbox.com/scl/fi/p091k40nmv145tcoim020/Three-dimensional-visualization-of-sound.maxpat?rlkey=3ni75uxbdbo1di3sht2l14xtz&dl=0

Use of srcdim and dstdim object

In the patch, you can see that I used two objects, srcdim and dstdim. The following are videos to explain the contrast of image changes caused by these two controlled parameters.

The difference between srcdim and dstdim is that the former controls the scale amplitude of the whole matrix, while the latter can update the scale amplitude of the upper or lower edge in real time. Because the audio signal is a one-dimensional matrix, after setting its X and Y axes, it will form a ground-like waveform that changes like a mountain.I use this principle to realize the change of patterns.

The following is a link to the patch about the comparison between two objects:https://www.dropbox.com/scl/fi/mbb4gf6yzz50a2a7t4d9f/dstdim-vs-srcdim.maxpat?rlkey=9t5rdkwz5nghne4sp8s7znp72&dl=0


Background

Overview 

Mathivanan (2017, p. 374) defines presence as the psychological experience of feeling completely enveloped within a virtual environment. Expanding on this concept, our group is inspired to craft an interactive, immersive installation to create an audio-visual virtual environment.

This project, Thalassophobia, is an immersive audiovisual installation that explores the fear of the deep sea. We aim to create an immersive experience using Max, sensors, and surround sound techniques to fully immerse the audience in the depths of fear.

The idea of having Thalassophobia as the theme is inspired by sea-based horror films, such as Jaws (Spielberg, 1975), Deep Blue Sea (Harlin, 1999), and Open Water (Kentis, 2003). Our project has four different layers. Throughout the immersive journey, the visuals and soundscape will gradually expand, unveiling different layers of Thalassophobia into the experience.

Our original plan was to structure the experience linearly, guiding audiences through escalating levels of fear toward eventual calmness. However, our project took a different approach in the final presentation, opting for a non-linear looping structure that allows participants to shape their experience through the depths of Thalassophobia. We designed four distinct levels, each presenting a different progressive level of phobia using sounds and visuals.

Participants will navigate these levels by actively engaging with sensors and a level controller, allowing for a dynamic and interactive experience. The first level explores the realm of sea monsters, providing a concrete and general understanding of Thalassophobia. The second level explores the physical and mental responses triggered by Thalassophobia, offering insight into its internal impact.

The journey then deepens with the third level, confronting participants with the abstract fear of the unknown inherent in Thalassophobia. Finally, the fourth level offers a peaceful state, reflecting upon and contrasting the deep-seated fears of the ocean’s depths. This four-level loop allows participants to choose their starting and ending points, allowing for a more personalized and creative journey into the depths of Thalassophobia.

Through dynamic audiovisual elements and interactive storytelling, Thalassaphobia aims to evoke a range of emotions and sensations, allowing participants to engage with their creations in an immersive way.

Similar Art Work

PlayLoop

PlayLoop (Wong, 2023) is an innovative interactive installation merging sound and light, allowing participants to craft distinct audio compositions through physical interaction with multiple audio loops within an immersive soundscape. Employing light-emitting diodes and motion-activated sensors, this project offers a dynamic platform for interaction and creativity.

The work embodies two core concepts. Firstly, the most important idea of this project is ‘Group Creation'(Wong, 2023). The installation is designed for multiple participants. The more individuals engage with it, the richer and more complex the sounds become. This installation encourages collaboration, inviting participants to collectively shape the auditory experience through harmonious melodies, discordant rhythms, minimalist arrangements, or complex soundscapes. The second concept of this project is ‘Co-creation’. Participants are encouraged to collaborate with the artist to create soundscape together. Every participant is essential and becomes a creator in creating the auditory and visual environment.

This project is similar to our project in how participants are involved and the core ideas of ‘Group Creation’ and ‘Co-creation’. Our project utilizes sensors for real-time interactions. We offer opportunities for participants to craft their soundscapes freely by interacting with the different sensors and the main controller. The more people interact with the sensors. The soundscape would be chaotic and scary. In addition, participants do not just collaborate with each other in the presentation. They also co-create the soundscape with us by randomly switching between different sound effects, chords, and filters.


Promo Video

-made by Ruojing Chen & Yuan Mei


References

Harlin, R. (1999) The Deep Blue Sea. Warner Bros.

Kentis, C. (2003) Open Water. Lions Gate Films.

Mathivanan, K. et al. (2017) ‘A Study of Virtual Reality’, International Journal of Trend in Research and Development, 4(3), pp. 374-377.

Papersneaker (2019) ‘PLAYLOOP – Interactive Sound & Light Installation’. Youtube. Available at: https://www.youtube.com/watch?v=qvQCBNEG-Rc (Assessed: 15 April 2024).

Spielberg, S. (1975) Jaws. Universal Pictures.

Wong, N. (2023) PLAYLOOP – Interactive Sound & Light Installation. Available at: https://www.papersneaker.com/single-post/2019/09/09/playloop-interactive-sound-light-installation#:~:text=%E2%80%9CPlayLoop%E2%80%9D%20is%20an%20interactive%20sound,speakers%20within%20twelve%20cylindrical%20structures (Assessed: 15 April 2024).


Week11_Final_Presentation_Yuan_Mei

This week, before our final presentation on Wednesday, our project had to make a significant decision. We decided that having a non-linear loop structure would be most advantageous for our installation. This decision is made because the pace of audience interaction with the level button cannot be predicted. We don’t want audiences to rush through all the levels. Such a result would not align with our project idea and goals. 

Choosing a non-linear looping structure reduced the user’s risk of moving quickly through each level and prevented the viewer from prematurely ending the immersive experience. Therefore, our project did not end at the last peaceful level, followed by a cycle of four levels starting with the viewer’s interaction with the main controller buttons. This change ensures that audience engagement remains dynamic and allows for a more immersive and controlled experience.

In addition, we received valuable feedback from the audience during the final presentation. Based on the feedback, we took action quickly to enhance our project’s clarity. One insightful suggestion was emphasising the theme, ensuring audiences catch the project’s idea. We promptly designed and displayed a poster at the entry point to address this. This placement ensures that every visitor to the room is immediately introduced to our project’s theme, fostering better understanding and engagement right from the start.

Another valuable feedback suggested relocating the instructions for interacting with the sensors to the top of the box rather than placing them aside. This adjustment significantly enhanced the audience’s experience, making the instructions more readily accessible and easily read while engaging with the sensors. By implementing this improvement, we ensured that participants could quickly understand how to interact with the sensors, facilitating a smoother and more engaging experience for everyone involved.


Additionally, we received suggestions for further enhancement during submission 2. One suggestion addressed the narrow frequency range, particularly the underutilization of the high frequency across some levels. This feedback prompted us to make adjustments to ensure a better listening experience. By implementing sounds in different frequency ranges across the levels, the project will be optimized, having a richer and more dynamic auditory experience for our audience.

Below are some short videos that we recorded during the presentation.

Interaction:

Location setup:


Week11_Final Performance_Ruojing Chen

Yesterday was our official performance.
Yesterday morning, we learned that our midi controller was reserved by others, so we had to borrow a new one, but we had already made a cover for the previous midi controller, so we urgently made a new cover for the new controller in the morning.


Before the evening performance, we also met Joe, hoping to solve the problem of the sensitivity of video operation controlled by our sensor, and finished the problem before the performance.

Before the performance, Jules came to experience our project setting in advance, and gave us some suggestions especially about patch, which affirmed our efforts and was very happy to see that we applied what he taught us.
Jules’s advice is as follows:
1.Set more speaker controls to seek a better sound experience.
2.Add frequency levels of music or sound effects to make it sound richer, such as high frequency.

During the whole performance, we also received suggestions from different teachers, and we are constantly improving what we can modify during the performance.For example, in the on-site furnishings, the design of posters and the use of sensors, we have refined and temporarily added them.

As for the design of the whole project content itself, I asked several teachers and got the following suggestions:
1. The venue setting can be a little darker, highlighting the terrible and unknown immersion (some teachers recommended ECA to go into the all-black classroom).
2. The pattern transformation of the video is very abstract, but it can also be a little more narrative. For example, the pattern that increases the intention of falling quickly indicates that the player falls into the ocean and highlights the fear.
3. If there are more channels coming from above, it will highlight the immersion of the characters on the seabed.

Thank you very much for Leo’s serious and responsible company, Jules and Joe’s technical support, all the teachers, classmates and friends who came to watch, and all the members of DMSP_presence group.

Week11_Final_Presentation_Jingqi Chen

This week is final presentation week. The time set by our presence group is from 18:00 to 20:00 on Wednesday night, at the Atrium of Alison House. The reason for setting it at night is that we want a darker environment, which will greatly increase the immersion for our installation, and the value of the light sensor will be easier to control. But the sudden arrival of daylight saving time caught us off guard. Although the brightness is higher than originally expected, the on-site effect is still relatively good.

Following are some videos of the final installation:


Sensor Sensitivity Issues

In the afternoon before setup on the day of the final presentation, I met with Joe at the scheduled time to resolve the sensor sensitivity issue. Joe pointed out the problem with the sensor sending data part of the original Max patch, that is, I divided the information received by the sensors on the same Arduino Uno into two route objects (see Figure 1).

Figure 1: The Sensor Sending Data Part in the Original Max Patch.

This will cause Max to only receive one of the sensor data allocated by the route object, and cannot output the data of all sensors at the same time. After gathering all the data into a route object, the data transfer ran normally (see Figure 2).

Figure 2: The Sensor Sending Data Part in the Modified Max Patch.

In Arduino, Joe suggested changing delay() to yield(), so that the code can run step by step without affecting the progress of other tasks (see Figure 3).

Figure 3: The Application of “yield()” in Arduino Project.

After these adjustments, the sensor sensitivity problem was successfully solved. This greatly helped improve the integrity of our installation while ensuring fun.


Ending

In addition, we intensively discussed the ending settings before the final presentation. Considering that each user’s perception of emotions is different, some people may want to escape from the environment after calming down, but some people may still be immersed in it and want to feel it again. So we decided not to limit the specific ending, but to let users choose which level to end the experience. This means that the four levels are in some kind of loop. After users press the button to reach the fourth calmness level, they can continue to press the button to restart the first level, and so on. That is, users can press the button an unlimited number of times until they want to end at a certain level.


Feedback

We also received some very helpful feedback on site. The first one to arrive was Jules. He experienced the entire interactive installation on his own and gave very substantive advice (see Figure 1).

Figure 1: A photo Showing Jules Giving Feedback.

The first thing is that most of our sound samples are concentrated in the same frequency band, mostly in the middle and low frequencies, resulting in the phenomenon that music and sound effects are easy to “fight” with each other, so that the two can not being well highlighted or integrated together. The solution is to replace some music and sound effects with higher frequency sounds, such as piano arpeggiated melodies or high-frequency sea monster sounds.

The second one is that it would be more immersive if we could add four speakers above to create an underwater perspective. Since our theme centered around thalassophobia, it would have been more engaging to create a deeper ocean atmosphere on site.

The third one is that we would better make a poster and stick it on the door outside, so that everyone can have a general understanding of our group’s installation before entering. So we drew our own cute posters and put them on the door of the Atrium (see Figure 2 and Figure 3).

Figure 2: Poster making process.

Figure 3: Poster of our group’s installation.

The last point is the placement of hardware equipment. Jules suggested placing the two sensor boxes in columns together on the table, rather than in the same horizontal row (see Figure 4). In this way, when the user controls one of the light sensors, the other light sensor can also be controlled together, so that the user can better feel the changes in sound and vision at the same time.

Figure 4: The Placement of Hardware Equipment.

During the formal presentation, a tutor made a very clever suggestion about the placement of our equipment. She suggested that we could attach the sensor usage instructions directly to the sensor boxes, so that users do not have to glance at the iPad next to them and then come back to interact with the sensor, which reduces some troublesome steps. Therefore, we wrote small notes with instructions for each sensor and posted it on the sensor boxes for the convenience of users (see Figure 5).

Figure 5: Sensor Instruction Note.

Most users found our interactive installation interesting, but the visuals could be richer and the sensor settings could be clearer. Overall it’s quite immersive. I am personally satisfied with the overall setup on site (see Figure 6). It can be easily understood by users without losing the sense of atmosphere. What we need to do now is to analyze the feedback we get in the presentation and solve the problems found. In addition, I personally think that some optimizations can be made in the software, such as making the project look more concise and clear.

Figure 6: On-site Installation Setup.


Thanks very much for everyone’s hard work during this time. Special thanks to Jules, Leo and Joe for their strong support and technical help. Thanks also to all the teachers and classmates for attending. From the prototype in the first week to the actual implementation now, I am very moved by the step-by-step efforts of our Presence group. Thanks to my group members.


css.php

Report this page

To report inappropriate content on this page, please use the form below. Upon receiving your report, we will be in touch as per the Take Down Policy of the service.

Please note that personal data collected through this form is used and stored for the purposes of processing this report and communication with you.

If you are unable to report a concern about content via this form please contact the Service Owner.

Please enter an email address you wish to be contacted on. Please describe the unacceptable content in sufficient detail to allow us to locate it, and why you consider it to be unacceptable.
By submitting this report, you accept that it is accurate and that fraudulent or nuisance complaints may result in action by the University.

  Cancel