Overview
The sound design of this project is strategically divided into two principal components: diegetic field recordings and nondiegetic data sonification.
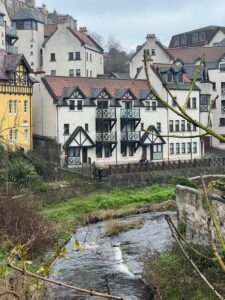
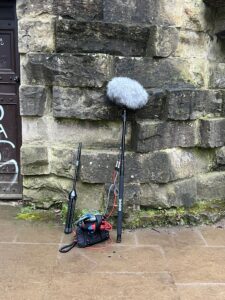
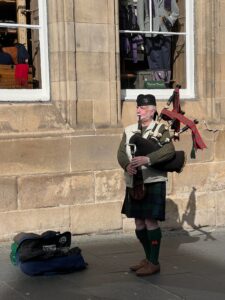
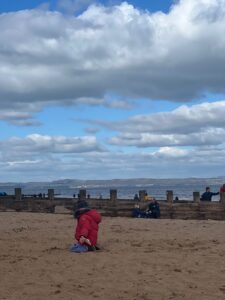
Diegetic Component: This segment includes field recordings from iconic locations across Edinburgh, such as Royal Mile, Princes Street, and Dean Village. These recordings act as auditory snapshots, capturing the distinct soundscapes of each area. By weaving together these snapshots, we construct a rich soundscape that encapsulates Edinburgh’s diverse auditory essence. This approach allows exhibition visitors to immerse themselves in the complex soundscapes of Edinburgh, experiencing it as a cohesive hyperobject within a singular exhibition space.
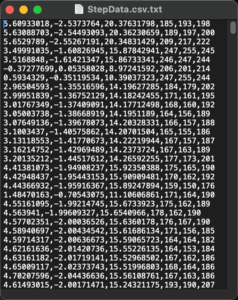
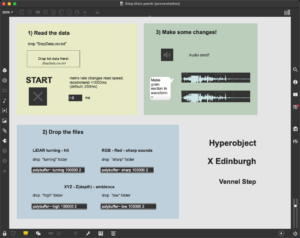
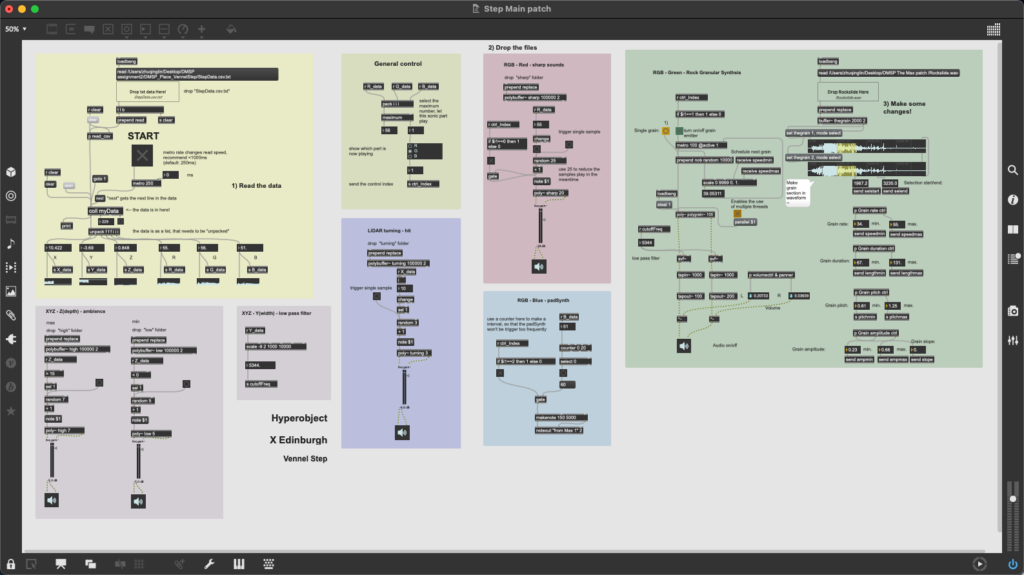
Nondiegetic Component: This aspect focuses on the sonification of LiDAR scan data, employing Max/MSP to forge a connection between data points and auditory experiences. Specifically, we sonify spatial (XYZ) and color (RGB) data from two selected places: Vennel Step and Dean Bridge. While the Max patches for both locations share a basic logic, modifications have been made in audio sample selection and data mapping to reflect the unique characteristics of each site.
Venue Setup
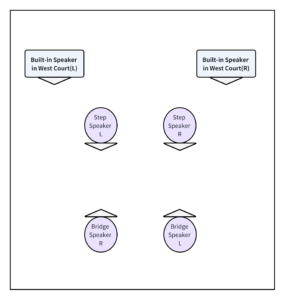
The exhibition’s audio setup will utilize the West Court’s built-in stereo speakers, complemented by four additional speakers. The built-in speakers will play the field recordings, whereas the four supplementary speakers, organized into two stereo pairs, will individually play the data sonifications for Vennel Step and Dean Bridge.
Sound Design Preview
2.1 Diegetic Field Recording
The field recordings from various locations will be edited into several one-minute segments, interconnected by ambient music transitions. Each segment will be introduced by a voiceover, delivered in a Scottish accent, naming the featured location. These sequences will create a continuous 15-minute auditory journey.
2.2 Nondiegetic Data Sonification
Within the Max patch framework, RGB data-driven sounds emerge as primary sonic elements. A general control mechanism assesses the RGB values to identify the dominant color, which then activates the playback of a color-correspondent sound. This sound mapping process is influenced by subjective color associations: red with sharp, intense sounds; green with natural sounds; and blue with harmonious synthesizer sweeps.
In addition to color, the Z data, representing the depth of a location, serves as a complementary element in the sonification. Sounds are strategically mapped to the extreme values of Z data, offering a varied sonic experience that mirrors the diverse altitudes encountered within the scanning locations. Furthermore, significant shifts detected between adjacent rows of LiDAR data—marking the completion of an angular scan—are signified through a distinctive “hit” sound, thereby audibly marking the progress of the scanning process. Other data types, not directly converted into sound, serve as control signals that adjust sound parameters such as cut-off frequency and volume in real-time, adding a dynamic layer to the auditory experience.
Conclusion
This project represents a pioneering endeavor to merge the realms of environmental sounds and data sonification into an immersive auditory experience. By capturing the essence of Edinburgh through field recordings and interpreting physical data through sonification, we offer a unique dual narrative of the city. This innovative approach not only showcases the potential of sound as a medium to interpret and represent LiDAR data, but also invites audiences to engage with the environment and data in a deeply immersive and sensory manner.