Sonification understands as the use of sound to convey information or data. It transforms data, such as numbers or measurements, into sound signals or musical notes the listener can hear and interpret. As such, a rich and representative data set had to first come into place to develop the actual “sonifying” procedures further.
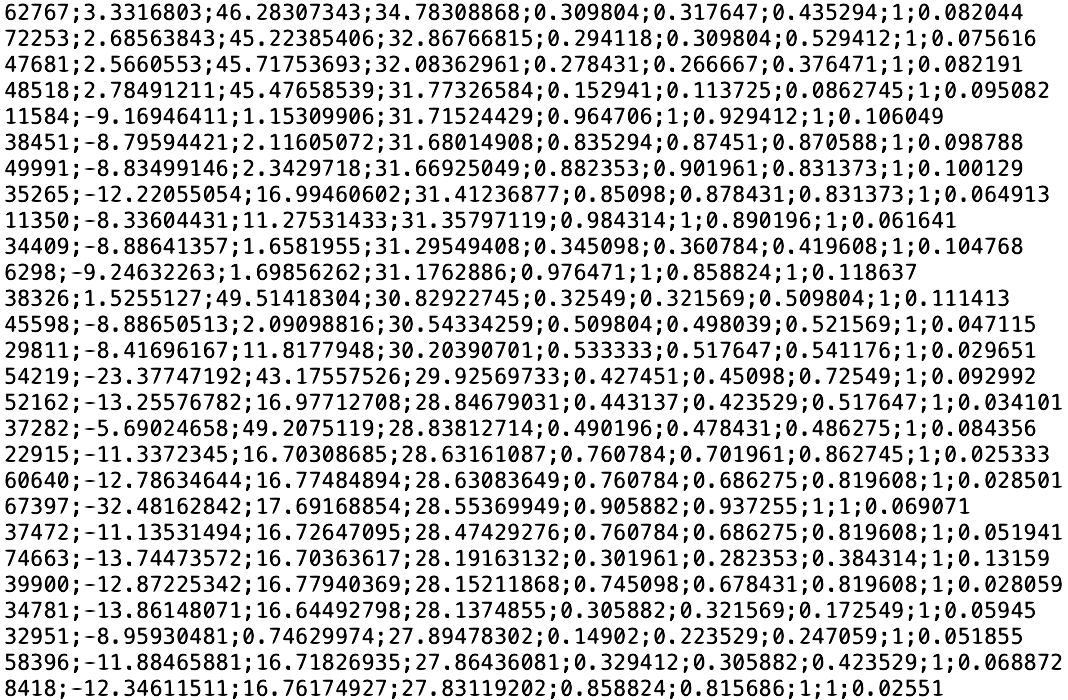
A point cloud scan based on a LiDAR scan, in its essence, is a recording of individual distance points from the source (the scanner) that are then correlated and represented together in space within a digital domain. For example, the project found that each scan performed with the Leica BLK-360 composes approximately 4 million points. For the aggregate collection of points to provide a high-fidelity capture of a given space, each of these points must contain there own set of common properties. Through CloudCompare software, we managed to understand that this set of properties corresponds to positional (XYZ) and colour (RGBA) coordinates, as well as an “Intensity” value that seems to correlate with the reflectiveness of the surface. While in cloud compare, we also learned ways to export the aggregate data set into its text format. It now meant that point cloud data could easily feed a Max/MSP system but also be treated and organised through an excel spreadsheet in meaningful ways towards the sonification procedures.
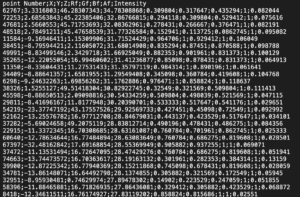
The ability to import this data set into excel allowed two crucial aspects, it allowed to create/calculate new variables and also allowed to organise data in a more meaningful and readable form. Both the text and the excel format presented a structure where each line composed a point, and with a total of 8 variable rows:
-
- X (x-axis coordinate)
- Y (y-axis coordinate)
- Z (z-axis coordinate)
- R (red colour coordinate)
- G (green colour coordinate)
- B (blue colour coordinate)
- A (alpha colour coordinate)
- Intensity (reflectiveness of surface)
We also observed that the point sequence was not correlated to any of the above parameters, which led to an understanding that this sequence followed the capture order over time. Since the sonification means fixed on the spatial qualities of the capture, the data set was re-ordered over the z-axis from top to bottom. However, this time-based variable was not completely disregarded. At first, to monitor the re-ordering operation, all of the lines were previously numbered, creating a point number variable. This new variable seemed interesting due to its rich uncorrelatedness to any other variables when ordered on a specific axis, so it was kept and later sonified. Other possible variables were imagined to be calculated, such as the respective vector or, if in the absolute value, the distance from the source. However, a set of nine variables already seemed plenty to work with.
The last aspect of the data treatment came from later learning the memory thresholds of the designed max patch (which will be discussed over the next few posts). Through trial and error, we found that the max patch could only hold an approximate maximum of 100.000 lines (txt. file). As previously stated, each scan recorded approximately 4 million points, and the achieved point cloud model composed a collection of 9 to 12 scans. This file size could never be processed through the methods used and the available resources. Luckily, CloudCompare provides downsampling tools that reduce the points evenly across the model to a desired amount, providing sonifiable-sized data whilst conserving the model’s integrity. Therefore the entire data collection and reorganising process described until now had to be performed for a downsample of 100.000 points.
This post reports the first step of many over the sonification task, and as such, more related posts will follow in the upcoming weeks.
If you’re reading this in order, please proceed to the next post: ‘Sonification #2 – Interpolation and Data Flow’.
David Ivo Galego (s2272270)