Any views expressed within media held on this service are those of the contributors, should not be taken as approved or endorsed by the University, and do not necessarily reflect the views of the University in respect of any particular issue.
Digimap is an online map and data delivery service, available by subscription to UK Higher and Further Education establishments. Operated by EDINA at the University of Edinburgh, Digimap offers a number of data collections, including Ordnance Survey, historical, geological, aerial photography, LiDAR, marine maps, land cover mapping, global mapping and census data. For more information about Digimap go to our website: https://digimap.edina.ac.uk Background image Contains OS data (c) Crown Copyright and database right 2022
GeoForum is a free all day event aimed at lecturers, researchers and support staff who promote and support the use of geospatial data and services at their institution. Throughout the day we there will be talks and demonstrations to inform you of current geospatial developments at EDINA and the wider community. It is also an opportunity to give EDINA feedback on the services we provide and discuss geospatial issues with the team.
Full details of this years event will and the programme will appear on the website when available:
This year we will be introducing some changes to the geospatial data services offered by EDINA to the academic community. These include new Ordnance Survey data products and updated licence agreements for most of the Digimap Collections. We also hope to present some case studies from staff and students who have been using data from Digimap and the other geospatial services from EDINA.
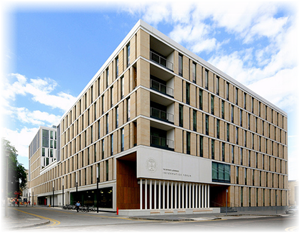
The conference will be located in the University of Edinburgh’s geography department on Drummond Street. We will also be highlighting what we have done over the summer to improve Digimap.
The conference is free to attend and runs from 10:00 till 16:15, for all the details and to book your place please visit the conference website: GeoForum 2016
Please contact us if you have any questions:
Email: edina@ed.ac.uk
Find out what happened at last year’s event: GeoForum 2015
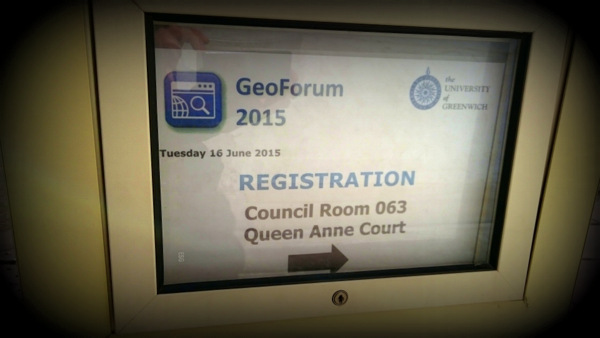
For this year’s GeoForum we were lucky enough to be in the Old Royal Naval College at Greenwich, now home to the University of Greenwich. Around 60 delegates enjoyed a programme of talks and presentations aimed at keeping them up-to-date with the maps and mapping technology available to higher education.
The day began with Professor David Maguire, Jisc Chair, Vice principle of the University of Greenwich, former chief scientist at Esri and an acknowledged expert in computer mapping, outlining his vision of the future of both Jisc and Geographic information science. There was emphasis in his talk about the need to incorporate the Cloud in both Jisc’s services and into the Geographic Data and software services.
The first full presentation of the day came from Christopher Wesson, one of the founding members of Ordnance Survey’s digital Cartographic Design team.
Christopher gave some background about Ordnance Survey and the data they are now creating. He then took us through eight key principles that used to create successful cartographic designs: User Requirements, Display Format, Visual Hierarchy, Simplicity, Legibility, Consistency, Accessibility and Good Composition.
Building a 3D Model
The Next presentation came from Jason Taylor, a technical tutor at Ravensbourne responsible for the production of physical models and prototypes. Jason took everyone through the step by step process of taking terrain data along with building foot prints and heights to create scale models of cityscapes.
The result of his work combined milling of MDF particle board and also 3D Printing of a miniature Millennium Dome. Nearly all of the data used in the production of the model came from Digimap (the details of the Dome’s shape came from a different source), and Jason highlighted the help pages as a great resource for helping him and his students begin to create their models.
The Ordnance Survey Licence
Emma Diffley, EDINA Geoservices Support team leader, then took the audience through the major changes made to the Digimap Licence for Ordnance Survey data.
This important presentation highlighted the main differences between this agreement and the one it replaced, showing that it is more permissive than before, and that there is now an End User Licence Agreement (EULA) which places emphasis on the individuals to ensure they are abiding by the terms and conditions.
Lunch
During the Lunch break we had presentations from Esri‘s Addy Pope about the ArcGIS Online service; from the CadCorp team who highlighted their free GIS data viewer, MapExpress, and their discounts for educational use; and finally from the British Geological Survey who highlighted their subsurface data and Groundhog website.
Digimap Update
After lunch the delegates were split into two groups with half doing the excursion while the other half was updated on the latest work going on with Digimap and the other Geoservices run by EDINA.
Guy McGarva, EDINA Geoservices Support, gave the Digimap Update presentation highlighting the past year’s achievements and the plans for the coming year. Much of the coming improvements are to do with improving access to the service for mobile devices and also to the data for CAD users. There are also a lot of new products and cartographic improvements to old products going into the Roam online mapping interfaces.
Guy also highlighted some future trends including better integration between services and a shift to delivering more training through interactive webinars rather than face-to-face training.
Fieldtrip GB
During the Fieldtrip GB excursion Ian Holmes, EDINA Geoservices Support, took the delegates through the process of designing a data collection form, deploying it to the groups mobile phones, collecting data points from around the Greenwich campus and then uploading the data and viewing it on a map. The entire process was carried out live for each group with the minimum of fuss, highlighting the mobile app’s usefulness for carrying out citizen science or group fieldwork.
We also found out about a few of the enhancements coming to the app, including:
more stable data management
the ability to longer and more complicated multi-page data entry forms
an entirely new version with OpenStreetMap data for use worldwide
the ability to upload your own maps or way-points to highlight where to collect data
Final Summary
We’d like to thank all the speakers and delegates at this years conference for taking part in a very successful event.
All the presentations throughout the day highlighted the changes in the world of digital mapping occurring right now. We hope that the changes highlighted in the Digimap Update presentation along with the rest of the planned at EDINA will mean the Digimap will continue to be relevant for it users and help them prepare for future work with maps and digital data.
Finally we’d also like to thank the University of Greenwich for providing a first class venue and event coordination team to ensure it was a memorable day.
An introduction to the day from Professor David Maguire, Jisc Chair, Vice principle of the University of Greenwich, former chief scientist at Esri and an acknowledged expert in computer mapping and geographic information systems.
A talk given by Ordnance Survey about their cartographic principles and how they apply them when designing the visual representations for features on their maps.
A presentation given by architecture and design staff and students from Ravensbourne showcasing the physical models they have been producing using or inspired by Digimap maps and data.
A round-up of all the things you need to know about from the recently updated Ordnance Survey licence.
University of Greenwich Queen Anne Court
As well as these presentations we will have our data and software suppliers present to tell you about their new and up coming products such as OS Open Map data, BGS Groundhog & ArcGIS Pro. We will also be bringing you up to date with all the new developments at EDINA and taking you outside in the impressive grounds of the old Royal Naval College to have a look at some new developments with EDINA’s Fieldtrip App.
Finally there will be time for you to chat with people from all the other institutions about how they support and promote geospatial data and software, there are already over 50 people registered to attend with over 25 different institutions represented so far.
If you haven’t booked your place yet then please do so soon, places will be limited:
GeoForum is a free all day event aimed at lecturers, researchers and support staff who promote and support the use of geospatial data and services at their institution. Throughout the day we there will be talks and demonstrations to inform you of current geospatial developments at EDINA and the wider community. It is also an opportunity to give EDINA feedback on the services we provide and discuss geospatial issues with the team.
Full details of this years event will and the programme will appear on the website when available:
This year Ordnance Survey’s cartography team will be telling us about how they go about creating cartographic representations of the map data. We’ll also be showcasing the work of students of architecture and urban design, highlighting how data from Digimap is crucial to their studies.
The conference will be located in the historical Queen Anne Court at the University of Greenwich, part of the Old Royal Naval College. In such surroundings we hope the weather will allow us to go outside for an afternoon excursion where we can show you the enhancements to our Fieldtrip mobile app while exploring the area. We will also be highlighting the many new datasets that have been added to Digimap over the recent months and giving you a sneak preview of what we will be doing over the summer to improve all the geoservices offered by EDINA.
The conference is free to attend and runs from 10:00 till 16:15, for all the details and to book your place please visit the conference website: GeoForum 2015
Please contact us if you have any questions:
Email: edina@ed.ac.uk
Phone: 0131 650 3302
Find out what happened at last year’s event: GeoForum 2014
Last week EDINA Geodata Services were exhibiting at the GeoDATA Showcase 2014 event in London. This was our second time to exhibit at this event which is aimed primarily at the commercial end of the GI industry covering current data and technology topics. This follows on from other events in the series as described previously on the GoGeo Blog.
We had a small stand, but the positive responses we got from visitors was very encouraging: from students who are currently using Digimap in their studies, to the lecturer in a university who said that Digimap was a great resource and essential to his teaching. Even more encouraging was the number of delegates and staff on other stands, with successful careers in the GI industry, who came up and said that they had used Digimap during their studies and it was a vital to their degree. It’s good to know that the future generations in the GI industry have the expectation that they will have easy access to high quality geospatial data, readily available from Digimap (at least while they are in education!).
We talked to delegates from a wide range of industries including environmental consultancies, government, data providers, local councils, defence and education as well as visiting and talking to many of the other exhibitors. We got a lot of useful feedback on what we’re doing and ideas for what we could be doing in the future including potential opportunities for collaboration. Of particular interest to delegates was the Fieldtrip GB app we were demonstrating which is a mobile data collection platform – especially once the magic word ‘free’ was mentioned, and also that there is an Open version available on Github.
Mince pies and mulled wine near the end were a welcome break from a long day, so busy that we didn’t actually get a chance to attend any of the talks, many of which looked very interesting, however it was a very useful event to attend. We look forward to next year’s event on the 3rd December 2015.
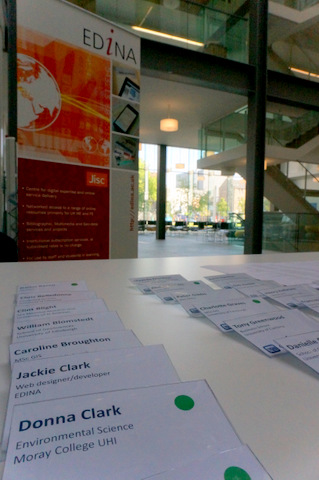
EDINA’s Geoforum 2014 was a great success with an audience of around 80 delegates and EDINA staff all enjoying an informative and entertaining programme. The aim of the event was to engage with users and support staff and highlight new features in EDINA’s core Jisc funded services.
There is a Storify of all the tweets about the conference here: Geoforum 2014 Storify
Keynote Address
Peter Gibbs is a well known for his BBC and Met Office weather forecasts and in his presentation he showed us the work that was being done by the Met Office and Environment Agency in combining their data and resources to predict not just where there is going to be rain but where the rain is likely to cause flooding.
Peter has a keen interest in improving public levels of understanding of science through better communication and this was very evident in his presentation. He managed to explain the complexities of how weather data was collected and used for forecasting in a very accessible way, leaving the audience with a much better understanding of how our weather and in particular flooding is predicted. We also got to see just how much data the met office use, up to 70 recordings at different heights for grid cells up to 1km2.
A key message implied in Peter’s talk was the critical importance of be able to create usable and appropriate information for your audience from the large amounts of complex and varied data available. This is something that as scientists we should all aspire to.
Data Usage
The next presentation came from a recent MSc in GIS Graduate, Darius Bazazi. The presentation followed on from the keynote nicely as it show how various datasets, some from Digimap, some from other sources, were combined to improve the science behind panning natural measures to control flooding. The slides for this presentation are available here:
The main issue tackled by Darius was to improve a key variable that decides whether an area is suitable for natural flood management, PROPWET (the proportion of time soils are wet). Darius used datasets such as the Centre for Ecology and Hydrology’s Landcover data to try and improve this value, bringing in vegetation cover and land use as factors that could influence it.
Darius’ talk showed how important the availability of data from a wide range of sources is key to research such as his. A large amount of researchers time, from graduate level upwards, can be taken up by finding and requesting / ordering data; Digimap and other geoservices from EDINA exist largely to reduce or eliminate the wait for data.
Support
Carol Blackwood finished off the morning’s presentations with a talk about the improvements EDINA are making to the support of their geoservices. The slides for this presentation can be found here:
Carol first told us about the work under way to replace the registration system for the Digimap collections. The main piece of good news is that there will no longer be a wait between registering and accessing the service. The new system will use the familiar email confirmation link to allow access once the registration form has been filled in. This will ensure that users have speedier access and also that their email is correct for collecting their downloaded data.
Carol also highlighted a few other things we are doing to support our users and also to improve the information available for site reps to promote Digimap. Firstly there is the new live chat system that allows people to have a text chat with the user support team. The chat window can be accessed from any of the help pages or the resource centre where it appears as a pop-up:
Finally Carol talked about the training offered by the Geosupport team, if you are interested in attending or hosting a training course then please get in touch with us: edina@ed.ac.uk. We can also arrange to do some bespoke training workshops or webinars for certain subject areas.
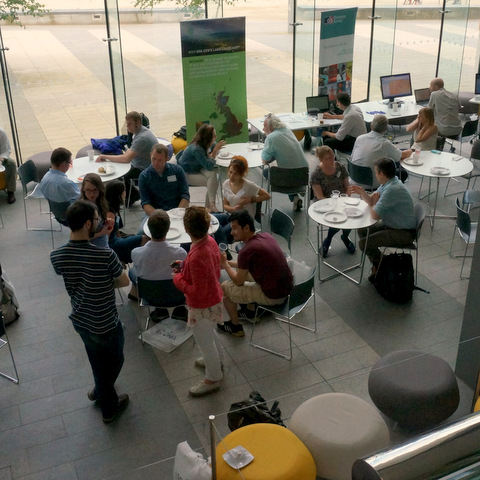
Lunch
During the lunch break we were treated to some delicious food and got to see some interesting data and software from the following people.
Most importantly we were given plenty of time to speak to others at the event, sharing ideas and thoughts on the presentations and demonstrations we had seen.
Service Updates
Guy McGarva brought us up-to-date with all the latest additions and enhancements made to Digimap over the past year, and then went on to highlight the improvements we will be introducing next. The slides for this presentation can be found here:
Guy showed how we are now using the results from the impact surveys and other contact with users to guide and prioritise the developments to the service. He also highlighted the huge amount of work that has gone on in the past year to the back-end architecture of the service that will make it much more reliable, maintainable and flexible going forward.
In the near future you can expect to see a new Download interface for Marine, after which will follow a similar upgrade to Historic Download including a better basket for all the downloaders, where you will be able to select data formats and dates more easily.
Have a look through the slides to see more of the upcoming improvements to the Digimap Service.
Mobile
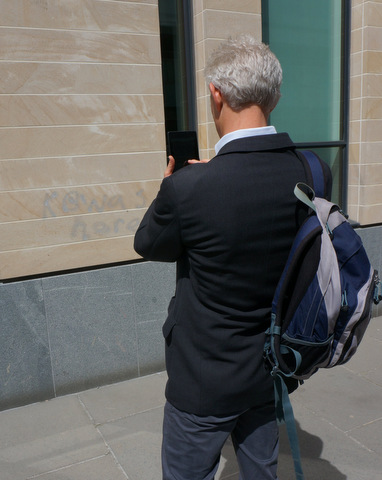
The last part of the day was a welcome trip outside in the sunshine to see how Fieldtrip GB could be used for Citizen Science projects. The slides for this presentation can be found here:
Addy Pope led the group through an exercise where a form was designed to collect data about graffiti which was then deployed to the groups smart phones and tablets. Everybody then took their devices outside and began collecting data such as photos and the type of graffiti found. The devices take care of logging the location, though the app does allow you to modify this if it isn’t quite right.
Fieldtrip GB had some glowing praise from the delegates, everyone seemed to find the it intuitive and. easy to use. A very good way to crowd source data without an expensive outlay.
Final Summary
A very big thank you to all those who attended Geoforum, we at EDINA feel it was a tremendously successful event.
The days presentations an exhibitions told a story, starting with the importance of geospatial data, especially to bodies of such strategic importance as the Met Office. We heard how research carried out at academic institutions was adding to the accuracy of the data and the models that use the data, and how important access to the data was in order to carry out this research.
The exhibitors showed us the next generation of data along with some of the software to process it. And finally, the presenters from EDINA showed what we are doing to improve the accessibility to the data; not just by making it available but by providing the support and training to realise its full potential.
Jisc continue to provide funding for services such as Digimap, GoGeo and Unlock which form the backbone of geospatial services available to the academic community in Great Britain. The Geoforum allows funders and service providers to engage with the user community which in turn helps focus service improvements.
A final thank you to everyone who helped make the event happen, the EDINA staff who helped organise, present and pack away all the equipment; the exhibitors; Bluesky Catering; and the staff at the Informatics Forum.
We are now taking bookings for EDINA’s Geoforum 2014 and with such a fantastic programme this year places could fill up fast. This year’s event will be at the University of Edinburgh in the award winning Informatics Forum, on the 19th June.
Geoforum is a free all day event aimed at lecturers, researchers and support staff who promote and support the use of geospatial data and services at their institution. Throughout the day we there will be talks and demonstrations to inform you of current geospatial developments at EDINA and the wider community. It is also an opportunity to give EDINA feedback on the services we provide and discuss geospatial issues with the team.
For all the details and a full programme please visit the website:EDINA Geoforum 2014
Environment
This year’s theme is the Environment and so we have lined up BBC broadcast meteorologist Peter Gibbs to deliver the keynote. Peter will be talking about the response being taken by the Met Office and Environment Agency to improve flood forecasting.
We also have a recent MSc Graduate talking about his use of LandCover data (available from Environment Digimap) with data from the Scottish Environmental Protection Agency (SEPA) in assessing natural flood management.
Colleges and Further Education
Along with the environmental talks we will also be introducing the upcoming Digimap for Colleges, a new service that sits between Digimap for Schools and the full Digimap service. There will also be an update on all the latest features and enhancements to EDINA’s geoservices.
More Details…
To find out what else we have planned for you, including this year’s excursion, and to book your place please visit the website: EDINA Geoforum 2014
Geoforum aims to bring together staff who support the use of Digimap and other geoservices from subscribing institutions around the country and showcase what’s new and upcoming from EDINA. It also gives people an opportunity to ask the Digimap team questions and to chat with others about how support and promote geoservices.
There was a live blog running throughout the day which is still available for you to read and find out what happened.
Keynote Address
The keynote was delivered by Shelley Mosco of The University of Greenwich and was titled: Digimap Data and a non-traditionalist approach. Shelley is a member of the The School of Architecture, Design and Construction and described the ways in which spatial data could be used to inform design. Shelley was keen to stress the importance of spatial data and GIS in the implementation of Building Information Models (BIMs). BIMs have been used in large engineering projects for some time, however the government is making them mandatory for all publicly funded building projects in England and Wales. This means that commercial organisations will be looking for students to have been trained in the concept of BIMs and the software that drives them. You can find out more about BIMs through the following links:
BIM Task Group – government site promoting best practise for BIM
COBie – Construction Operations Building Information Exchange
Two of Shelley’s current MSc students also gave brief overviews of their experiences of learning about GIS and using spatial data in their projects. Both David Parfitt and Robert Park were self-confessed GIS newbies, but they managed to get data from Digimap and use it in their conservation projects. The data allowed them to visualise and analyse the environment and provide evidence to support their proposed designs. Their demo’s were excellent a they really showed the power of simple GIS analysis.
You can view the slides from this presentation here:
After the Keynote was a presentation that focused on Open or “Free” resources for geospatial teaching and research. The presentation looked at software, web-mapping and data. The main resources are listed below:
Data
OS Open data is available through the Digimap Data Download service.
ShareGeo Open is a repository for open geospatial data. It has lots of useful and interesting datasets on a variety of subjects such as wind farms, crime, boundaries and DTMs
QGIS – one of the best open source GIS out there. Lots of functionality and plugins that allow you to perform complex spatial analysis. It is also well supported by forums.
GRASS – a remote sensing package aimed at serious remote sensor’s. If you are a newbie to remote sensing, you can access GRASS tool through the GRASS plugin for QGIS which makes things really simple.
Web-mapping
Digimap is a great web mapping tool, but how can you create your own interactive web map for your website?
MapBox – simple intuitive web site that helps users build interactive web maps. Basic functionality is free, more advanced functions are available for a small fee.
Leaflet – the engine behind MapBox, it is free but requires user to do a “bit” of programing
Openlayers – an alternative to Leaflet which is more flexible. Openlayers powers Digimap. Requires a fair amount of programming knowledge.
MapServer – implements Openlayers for enterprise scale operations. MapServer is also used for Digimap services.
You can view the slides from this presentation on slideshare here:
After lunch the lead of EDINA’s geoservices Support team, Emma Diffley, shared what we have been busy working on.
Interfaces
Digimap is being streamlined, each collection will eventually have just a Roam and a Download. These interfaces will all look and work in a very similar way. The aim is to make the service more consistent and easier to use, but also much easier to maintain.
EDINA will be withdrawing Digimap Carto on 31st July 2013. Carto, launched in 1996, is harder and harder to maintain, so we have taken the best bits and put them into Roam.
On top of the Carto functionality already added to Roam the following improvements are coming soon:
an improved way of saving and opening maps and annotations
a Basemaps button to change the style or even mapping product you are viewing at each scale
The Download interfaces will also going through a similar process.
Data
A single consistent style for all the vector products through all the scale levels accessible through using the basemaps button in the new Roam.
VectorMap Local (VML) in shapefile and DWG formats
ArcGIS layer files for symbolising VML shapefiles coming soon
OS MasterMap Topo available as DWG is being planned
Support
There is a new Resource Centre, which does not require login, with answers to questions, videos, case studies etc.
Beyond Digimap
GoGeo has added more resources and now highlights the “Editor’s Picks”
ShareGeoOpen now has over 210 resources all of which are open and free to use
FieldTrip GB is a mobile app for capturing data, see below
GeoTagger – a tool to allow you to edit the metadata for your photos
Cartogrammar – upload your data and visualise it in different ways
UKBORDERS is now the UK Data Service Census Support Unit
On the horizon
We are still awaiting news on funding, but are lots of things we would like to do. Currently our focus is to “mobilise” more services and we will be continuing to add new support materials once the latest round of Roam and Download changes have been made.
If there are things you would like us to do we really want to hear about them. Recommendations from the user community carry real weight for us, and we are keen to hear ideas on new data or services we should be providing.
You can view the slides from this presentation here:
The final part of the day was about EDINA’s new mobile app for carrying out field work Fieldtrip GB. It simplifies the process of capturing data in the field against quality cartographic mapping. It is equally at home in urban environments as it is in rural ones. Custom forms allow users to design their own data capture projects and collect exactly what they need for their research. The session gave a brief overview before running a “live” group data collection exercise. A custom form was created and deployed to participants mobile phones. They then headed outside and captured data on things like building fabric and design. After 15 mins everyone reconvened and the collected data was “synced” and exported to Google Earth.
You can view the slides from this presentation on slideshare here:
As mentioned earlier, there is a transcript of the whole day in the form of a live blog so if you didn’t manage to attend and want to find out what happened please have a look.
GeoForum 2013 takes place at the Congress Centre in London from 10am until 4.15pm tomorrow. Throughout the day we will be liveblogging so, whether you are able to join us or not, we suggest you bookmark this post (link here) and take a look late tomorrow morning for notes from Shelley Mosco’s keynote. Keep an eye on the same post throughout the day as it will be updated after every session. We also welcome your comments (below) whether during or after the event.
You can also take part in GeoForum 2013 via our Twitter hashtag, #geoforum2013, where you are welcome to comment, contribute and engage with the Digimap team and our GeoForum attendees. We will also be tweeting key updates, images and notes from the event so if you don’t already follow @EDINA_Digimap, now’s the time to do it!
Please Note: This is a live blog so please do excuse any typos, spelling issues, etc. and do let us know if you have any corrections, clarifications, or information to add – we’ll be happy to update the post accordingly.
Welcome – Emma Diffley, EDINA
Emma is welcoming our attendees to GeoForum 2013. We hold a GeoForum regularly but not every year so we are delighted to be holding this event this year but the next GeoForum may not be in 12 months time. Since we last met we have had a busy year. And we have been watching closely the changing funding and financial landscape as well as the changing strucure of Jisc. There is lots coming in the future and we’ll be showing you some of that today.
This afternoon we have an outdoor excursion, it’s a bit weather dependent, but either way there will be an interactive activity with FieldTripGB – even if it has to be indoors!
Keynote: Digimap Data and a Non-traditional Perspective – Shelley Mosco (with Robert Park and David Parfitt)
Shelley Mosco is a practising landscape architect and senior lecturer in GIS at the University of Greenwich in the School of Architecture, Design and Construction. She is also involved in research of living walls and green roofs as part of the school’s Sustainable Landscapes Research Group.
I am so happy to see you all here – I know that some of you have come a very long way to get here today – I’ve probably actually come the shortest distance! I will be presenting with my colleagues Rob and Dave, who will be showing you some of their work.
What I hope to achieve here this morning is that I know there are several people here from library services… I know some of you are keen to hear a bit more about how you can help the students find out what could be done with Digimap, how it is used in practice. And Rob and David will show you how they have been using Digimap. What I’m going to talk about first though is how landscape architecture uses GIS and Digimap – we are something of a non traditional discipline – and then show you some of those specific projects, and to introduce what’s yet to come. And a little bit on our new school building with nearly 4000 square metres of roof space for gardens, agroponics, etc. and we will be looking at collaboration, sponsorship etc. for use of that roof space.
I’ve mentioned a little about famous lanscape architects. Ian McHarg came from Scotland originally, and he eventually moved to America teaching at Harvard. We think of him as the grandaddy of GIS. He looked in the 1960s at the landscape as a whole, really connecting across to other disciplines. What he did, in addition to teaching, was he had his own practice. He was asked to build a new highway to New York. He had about 200 criteria to think about. He used a thing called “SIM” analysis. This is pre-GIS, this is all manual work with maps, felt pens – colouring in shades of grey or black for inappropriate areas. After 200 or 300 odd layers/overlays – and that layering is something that he, Jack Dangermond, and Carl Steinitz are particularly known for. So these origins of GIS and overlays actually come from a group of Landscape Architects.
At Greenwich, how it works, we taught using Ian McHarg’s examples as well as the work of Jack Dangermold and Carl Steiniz. That’s the place our thinking comes from. And that idea of layers, of finding the right location through shading and colouring. We’ve taught GIS to landscape architects since 1995 – when via DOS prompts. In 1996 there was a reaccredition and it was decided that landscape architects needed GIS the same way that we need AutoCAD. Now I don’t teach the SIM approach, I come at this from the perspective of a practicising landscape architect. It is about practical projects, wherever it is in the world, and they have to use GIS for that. GIS is a way to look at time, place and patterns. For me GIS is particularly powerful for looking at those patterns, for finding them. You can do that with SIM analysis but GIS allows you to do this in lots of ways quickly.
So looking at various views from Digimap here – we look at Base Plans, Topographical Analysis, 3D Data ArcScene) and Data Analysis. Using all these views allow us to find the best options, the best plans here. We have some of the best practicising GIS specialists at Greenwich, and we are trying to set up a Centre for GIS excellence – watch this space!
So, David and Rob will show you their projects shortly but I wanted to show you some of the best student projects from the last few years.
So this is Zoe Antonald’s work, looking at creating an Oxbow habitat around the O2 arena area. She’s used a vast amount of data, including historical data, to identify the best site for the Oxbow and created a 3D model and flythrough.
James Penney’s project looks at non permeable areas and ways of creating attenuation zones to reduce flood risk.
Paul Hadley looked at the “Boris Island” airport in London. He looked at the Norman Foster design but critiqued it from a landscape architecture perspective, particularly the maintenance of the special area of wildfoul and wetlands in the proposed area. He has identified where the site boundary should be, he’s looked at contours and topography, and he’s looked at some of the historical data for surface water flow accumulation. So where the waste water area occurs that should be more wetland than that. And proposed a new use of space and way to fit the airport into the environment.
Joe Perkins looked at ways to transform the Valley Gardens in Brighton and done an assessment of the site based on what it is and what it could be, based on Yann Sizeman’s work. So he has looked at why it was set up like that. He has located it towards heaviest footfall, also to traffic. He has looked at crossover of pedestrians and traffic – identifying why the green areas were not being used as much as they could.
Jiamiao Xu looked at Vauxhall Pleasure Gardens. Looking back to it’s past as open fields, and planning a nice open space. Using hydrology to inform Sustainable Urban Drainage and Attenuation plan – as part of his master plan for that space. And looking at sightlines at present and how this could be changed to creating more land form, more water, more biodiversity. And he also looked at access to the site. Looking at cycling distance, location of river boats, wanting everything within a 5 minute walking zone.
So… what’s new?
BIM. BIM is new for landscape architects – bit more established for architects. So, what is it? Building Information Modelling. One of the definitions (from Landscape Institute) defines it as building a virual digital information 3D model, rich in data that can inform the decision making pricess and answer quesions throughout the entire project lifecycle, implemented in a collaborative environment. It is about that Ian McHarg idea of collaboration and about sharing data across the full life of a project. As a landscape architect you understand that, for instance, for a tree the root system will spread and go underneath paving etc. Understanding that paving, what may happen, how that relates to other systems etc. is really exciting. From 2016 it is obligatory that all publicly funded projects must use the BIM approach. We have already had an email from the Institute for Landscape Architects to say that practices are already using BIM in private practices and want to recruit students who understand and are trained in BIM. And that is likely to therefore be crucial for accrediting degrees. The time is now for incorporating BIM.
Just to explain a bit more about BIM. You can take the same approach to, say, planning lunch. There are 38 different models for this. You have a Project, an Assembly, Materials. This is about planning with different permutations. This is the same concept – picking your bread, your sandwich fillings etc – are the same for architects and landscape architecture. This is mandatory information that must be provided at each stage. The Cabinet Office has created a template/package for this – COBie: Construction Operations Building information exchange. For me the tools for BIM will be GIS of course.
Now over to one of my students: David Parfitt.
My project is based around the Wandsworth area and the area around the River Wandsworth post industriliasation. There have been some projects to improve the landscape but I wanted to create a masterplan to connect and join these areas together. I used digimap to find the location of hard features, to look for opportunities. I had only used GIS for 12 weeks but I was able to use historic Digimap data to identify a large area of marshland that had been lost over the last 150 years or so. There is one tiny area of wetland recently introduced but overall it has been a huge loss of that type of landscape over time.
I also used topographical data to look at potential improvements, using contour mapping for flood prevention for instance. And making changes to the landscape to make it easier to engage and interact with the area. There is still wildlife present in the river so I wanted to focus on the water and look at incorporating that into the design at multiple levels. Looking at increasing the space for wildlife, but also for people to use, and to allow the river to expand in times of flooding. And I was able to create a masterplan using that GIS data and AutoCAD to propose new design aspects.
And finally to another of my students: Rob Park…
I have been at the landscape architecture course at Greenwich for the last year. It’s been a very steep learning curve with GIS. If you’d asked me what GIS is even 6 months ago I wouldn’t know. But I have learned how to use it, and I have enjoyed using it, and I’ll be showing you how central MasterMap data has been to creating this design. My own design is looking at redevelopment of an MOD site around the South Thames Estuary and Marshes (SSI). Indeed there are many SSI’s around the site, particularly close to that area of redevelopment. I spoke to the RSPB and they explained that one of the key SSI area issues is around habitats for the Nightingale, which is endangered and does have key nest sites here. So I had two choices. Suggest that no development takes place… or come up with a plan.
I used Mastermap to find out more about the area. I wanted to properly survey the site but being a former MOD site it’s surrounded by fences and I wasn’t allowed on to take photographs. So with that limited access I began to fall in love with GIS. I found 30 different types of habitat, and used that data to see which of those habitats is most useful to the Nightingale for nesting. Red are habitats the Nightingale depends on, Orange and Yellow are supporting habitats – so some development would be possible there if sensitive. That leaves large white areas on the map for development. And I wanted to create a sustainable community, including buffer zones around houses to mitigate their impact.
I didn’t have a clear idea of topography but ArcScene let me get some idea of that with the elevation data, to fly through that data. I also plotted the water accumulation data to see where flooding and water occur. 3D is great but for masterplanning the 2D data is really useful. I used some tools in Arc Map programme to look at that water accumulation, and what would be needed. This is drainage not based on pipes in the ground, but based on topographical features. I began to think about how to increase wetland, particularly wet woodland, the habitat most in decline in the UK. I also used data on the degree of slope and direction faced for planning planting and development.
So in a rapid process GIS lets me get a handle on issues pertaining to the site and to formulate a strategy, even without access to the site. And thus created a masterplan for a Zero Energy Development on the Hoo Peninsula.
Whilst I was working on the project Natural England deemed the site a triple SI. I felt sort of exonerated as the data I used from EDINA led me to the right sort of conclusion here.
Back to Shelley…
I do hope that this gave you an idea of how Digimap helps us as Landscape Architects, and how GIS is central to that.
Q&A
Q – Karl Hennermann from Manchester) I think Shelley’s comment about BIM – that’s very relevant. We hear from engineering companies how crucial it is for graduates to have BIM skills. There is a BS standard out there that includes those BIM requirements for 2016. We are struggling with how to teach this to our students, there are software products – do you have any particular recommendations.
A – Shelley) I would like to join you in trying to figure this out. We need to learn more about how to integrate with other disciplines, about how we bring this into our own course. I know the COBie sheet will be the starting point for us. Using that spreadsheet, then bringing that into GIS. I’m not sure exactly how we will do this but I know that everything to do with BIM fluctuates every day – new ways to do things, new instructions. I think we will be running the whole time to get something up and running for our classes. If you do not think that this will affect you I would urge you think again. *Any* discipline relating to buildings, the built environment or the landscape you will be working with people like us, with engineers etc. and you will need to understand BIM.
Comment – Carl) There is an AGI special interest group on BIM. How will EDINA fit into BIM here?
A – Emma) We will have to do something, but we will need to investigate further. However if you have ideas about what we can do to help, what we need to support you, then we very much welcome them.
And over to Emma for a thank you.
Open & “Free” Geo Software and Data – Tom Armitage, EDINA
Tom will be talking about various bits of open source and free data and tools which may be of interest and of use with the tools and data we provide. We are aware that everyone’s budget is tight so hopefully all free resources are helpful. This will be an overview of what’s out there and what we recommend of these.
So, firstly, why bother with open source? You may think it’s liable to break, that it’s flakey, that it’s just for nerds… but there are key reasons you should be taking note. The quality of free tools and data is vastly improved. When you think about the data there are no restrictions which can be particularly useful off campus, for commercial use – no need to go out and learn a new GIS system if you are using the same tools that can be used for commercial purposes – or for web publishing. Demand is changing too, industry has noticed that open source is important and they want students to have skills in programmes such as Quantum GIS. And cost wise? Well it is “free” but you have to train, to maintain, to support the use. But without that payment for a licence there is a significant cost benefit.
I will be talking about OpenSource, Free and Fremium. What do these terms mean? OpenSource is free to download, use and develop. Code or raw data is available to update or augment. Free tends to be free to download and use. Code or souce material is not available. Fremium is about free to download and use but with added functionality or material available at some additional cost.
In terms of Desktop GIS the key OpenSource systems are Quantum GIS (QGIS) – you do see this on job ads – and gvSIG. In terms of free tools AutoCAD Map 3D is free for academic use (only). This is more a GIS package. There is also AutoCAD Civil. Both of those systems are PC only though. In terms of Freemium you have things like ArcGIS layer viewer – but for full GIS stuff you need to pay for the full product.
Quantum GIS is free. It’s about the only GIS that runs on Mac. There is a huge user community with very active online forums and many people developing plugins and add ons. Version 2 – launching soon – will see parity in functionality in ArcGIS. And it is the one industry are using and asking for. QGIS will work with any database (Postress, MYSQL, ODBC, Esri, etc.). And Ordnance Survey are now producing styling for their own data – they now provide Style Layer Descriptor (SLD) Files and they work with OpenSource GIS software. They are not quite as good for symbology as some of the proprietary systems but it’s really good.
Some other notable players here in the open source GIS world include gvSIG – which has excellent foreign language support. There is also a mobile version. uDig is very easy to use but limited in functionality, and it hasn’t been updated for a while. And GRASS, the original open source GIS, is increadibly powerful but command line run. However someone has created a plugin for QGIS which is a very powerful and usable combination.
If we think about Cloud based GIS there are two options here for data visualisation and sharing. Google Earth Engine and ArcGIS Online. ArcGIS online allows you to create maps online, add lots of data from ESRI Microsoft OS, upload your own data, and share your maps. In the free service all maps you create are open for anyone to view. The Paid service is included in the top level CHEST deal and at this level you can keep your uploaded data private.
Google Earth Engine works very similar. There is a little additional analysis possible via Google Fusion Tables. The premium version allows you to host this locally (which is ok for Ordnance Survey data as long as it stays offline).
Warning: Ordnance Survey do not allow their licensed data to be uploaded to cloud services, particularly MasterMap data. Even if you are creating private maps with these services.
There are also various Web Mapping options out there. These are for displaying your maps online rather than perform analysis. Some will allow editing and data creation. MapBox is a Freemium service build on Leaflet; there is Leaflet itself – it is easy to use and very light weight but not very flexible, you have to use Web Mercator projection and only used GeoJSON or Native Layers; OpenLayers is very powerful and allows you to create interactive maps, but you need to know what you are doing and write the pages yourself – but there is a big user community out there to engage with, and you can use data from any WMS including the OpenStream; MapServer similarly. To give you a sense of just how powerful OpenLayers and MapServer are, they are the backbone of the Digimap Roam service.
So moving onto Data we have several levels here as well. In terms of OpenSource Data we are really talking about OpenStreetMap. In terms of Open Data there is OS OpenData, BGS OpenGeoscience, ShareGeoOpen etc. For Freemium the data includes Bing maps etc – where the data is good but usage etc. limited.
There are pros and cons to many of these data sets. OpenStreetMap is really good – even better in urban environments. But even the gaps are becoming less and less important as the data improves. But there is a lack of consistency here when compared to licensed data. But this type of data is called for more and more all the time – the point data in OpenStreetMap is particularly useful if available in your students’ area of interest.
The OS OpenData covers multiple Ordnance Survey data sets. Indeed 8 of the 14 views in Digimap Roam use open data. Data Download makes OS OpenData easier to use. OpenStream lets you pipe it direct into your web app or GIS. It’s good data and we provide a more usable route into that data for anyone with an @…ac.uk email address.
The BGS have taken a different approach – smallest scale data is available for download with larger scale data in online viewers. And we layer that data on OS OpenStream background maps rather than Google, Bing or similar.
ShareGeoOpen is a collection of 214 Open Datasets – mainly UK based. We would really recommend you contributing or encouraging students to contribute data there for reuse – particularly useful for identifying previous work and avoiding rerunning the same project multiple times.
Geospatial data isn’t, however, all about maps. Most data has an element of geospatial data or can be georeferenced – postcodes, place name, location steamp, IP addres for instance all have a geospatial element. Unlock Places is a way to put a point or polygon to virtually any data that has a spatial element, with global coverage (though better in the UK). And Unlock text lets you dig out geospatial references within text materials.
More information. OSGeo runs the FOSS4G Conference, as well as Grass, Quantum GIS and PostGIS. GoGeo lists most major free software resources. And EloGeo at Nottingham provides learning resources for GIS tools including
Q&A
Q) Is there a button in Roam to press to let students switch just to open data?
A – Tom) Not quite but the more information or “i” button will indicate the data set and license conditions. We could probably improve how we indicate that.
A – Emma) We have also considered running a whole separate Roam just for open data but we would need a business model for that. If you think that would be useful or have any comments or ideas around that please do come and talk to us.
Q) EDINA is an institution that farms out a whole series of products. There are lots of others as 4G comes together, as these things converge? I’m quite new to this so wondering where do you see this going? Where do you see the industry going?
A – Emma) We are a Jisc funded organisation so much of what we do is aligned with their vision, and we are clear that we produce tools for academic use. So we are not as much focused on public domain/freemium products for a wider audience but actually that is a tricky question as it’s not clear exactly where everything will be converging…
A – Tom) But you will see some of that work for the current/near future in our FieldTripGB demo later.
A – Addy) ArcGIS are pushing for GIS in the cloud. Ten years ago we wouldn’t have thought of Google as key mapping providers, now they are also providing GIS in the cloud. Those players are emerging. Roam is in the cloud – which seems to where the sector is going – but we could look to doing more processing in the cloud.
Comment – Kamie Kitmitto, Mimas) We have GRASS training materials in EloGeo as well.
EDINA GeoServices Review – Emma Diffley
At the moment you will be aware that we provide Digimap, GoGeo, geodoc, ShareGeo, Digimap for Schools – literally this is Digimap for Schools, Unlock, agcensus, and the UK Data Service Census Support is the new name for the data we used to know as UK Borders.
The first bit of big news is that we will be withdrawing Digimap Carto on 31st July 2013. It was launched in 1996. We haven’t been able to keep Carto working well and, meanwhile, we have taken the best of Carto and taken it into Roam, which is much easier to use. Things like overlays, being able to print to A0, being able to print to your choice of scale. You can now do these things in Roam – in terms of scale there are some limitations but we now support most formats or you can download the data and print yourself on larger/other fomats.
We have made some enhancements to Roam – Annotations: Save, Open, Import and Export (to various formats). You now have your own maps area making them much easier to find and access what you have already created. Basemaps is another new thing. If you are familiar with the data there are various flavours of basemaps – and you can now pick between any of these that are available at a given zoom level. We have also added printing from Ancient Roam to PDF. And it is now the case that all Roams will support (currently in Ordnance Survey only) from A4 to A0.
In future for all Roams we are trying to make a cleaner interface, keeping it consistent across all Roams. There will be a convergence of look and feel across all Collections. There will be better printing controls. And there will be simpler, combined map and annotation Save/Open between Roams (e.g. accessing the same selected area). And there are additional overlay options coming soon (boundaries, contours…).
We have also made some data improvements. We have the VectorMap Local Shapefiles – we’ve converted all tiles to Shapefile and layer files for symbolisation are in production. VectorMap Local DWG will be available which will be good news to AutoCAD users. VectorMap Local is almost but not quite as detailed as MasterMap. All tiles have been converted to georeferenced DWG (with some styling) and will be available very very soon. OS MasterMap ITN will see improved performance with reduced file sizes. OS MasterMap Topo – DWG planned her soon. The DWG release will be a beta release really – we’ve done a lot of work to get this right but we are looking for feedback on these. We’ve made a first step on this though.
We’ve also been making some further tweaks to data. Strategi data has some potential for styling – with features not to be shown at smaller scale, e.g. Tourist symbols. And with the Meridean 2 and LandForm Panorama data we have done VML styling to make it more accessible and easy to use.
We have been harmonising Data Download so that all OS data is provided through one client encompassing MasterMap Download and Boundary Download (those separate downloaders have therefore been withdrawn), including all OS Open Data and Digimap Licened data. And we have the new Geology Download coming soon, more to follow.
We have also made some Help and Support Enhancements. We have a new Resource Centre, which does not require login, with answers to questions, videos, case studies etc.
On GoGeo we have added more resources and highlighting of the “Editor’s Picks”. You can search for data among 20,000 records from data providers around the world. Workshop resources introduce the importance of metadata. GoGeo also searches ShareGeo and ShareGeoOpen for data. ShareGeo Open includes over 210 resources all of which are open and free to use. You can share your data here and then cite the URI in publications, use data in projects/research/teaching contexts. That data gets used, seen, reused.
FieldTrip GB is a mobile for capturing data – you will get to try that out later!
GeoTagger is a tool to allow you to edit the metadata for your photos – which can then be useful for research or for use in sharing sites. Usually that will be about adding location data, perhaps occasionally you may want to remove that data. The idea is that you can tag images of your fieldtrip for instance.
Cartogrammar is another project, the idea is that you upload your data and it generates a different interpretation and visualisation of your data. It’s a fun thing to play with and explore your data in different ways.
UK Borders is no longer UK Borders. It is now the UK Data Service Census Support Unit. Underneath it’s the same data and code but it looks different on top. There is a link from the UK Data Service Census Support Unit website. All applications now in the UK Data Service style. Functions and data remain unchanged. Training now available via webinars. All support enquiries to go via online enquiry page – those eventually come to us but mean the UK Data Services are able to track those requests and support. There are some aspects of the Census programme as a whole are still in flux but that UK Borders data is still there for now.
So, what’s on the horizon? Well we are still awaiting news on funding. There are still lots of things we would like to do. If there are things you would like us to do we really want to hear about them as your recommendations carry real weight for us. And we are keen to hear our ideas on new data. We are looking to “mobilise” more. And we will be continuing to add new support materials.
Q&A
Q – Shelley) Can you say a big more about agcensus
A) It’s actually one of our oldest services. It provides agricultural census data – things like number of sheep, cowd, grain etc. It’s simple data but useful. It comes from
Q – Shelley) Could you use this for teaching animal management – how many sheep on a chalk bank in a particular area for instance?
A – Tom) It would be amount of meat harvested per square metre. Would that be appropriate? And there is a long history of this type of data, and long term data.
A – Shelley) That would be useful, particularly for comparing rural agricultural yields with urban yields for instance.
Comment – Emma) It is a subscription service. There is an institutional price or there are variations – institutions, personal, project and one-time subscriptions are available.
Q – Shelley) Can you say a bit more about bringing in environment data in Digimap?
A) We have undertook to include land cover data into our services. But the financial landscape changed since we took that decision. The data is ready to go but we are waiting for an official go ahead for releasing that.
A – Shelley) It’s data that we need in our work and our department for sure so we’d love to see that in there.
Comment – Tom) I’d love to hear more about the printing interface – what you and your students might like to see. Should it show less? Should it show more? It’s so hard to get right. That preview needs to look like what will be printed – but it can’t be perfectly the same so what makes the most sense and is most usable?
Comment – Emma) We need area, paper size and scale to all feed in here. There are limitations between those factors. People want to see exactly the area at the sane scale – but you can’t get A0 full size on a screen. You can’t show the extent and scale on the same image. We did think about tabs for different views but that’s not ideal either. Really you cannot have a WYSIWYG interface – you will get what you request but we can’t display it in the preview appropriately.
Comment) On most print previews you see the relationship between the preview and the page – can you do that?
A – Tom) The thing is there is no way to do that correctly unless you generate the PDF – which will take the same amount of time to generate the preview as to generate a PDF. But there’s no limit to how many PDFs you can create!
A – Emma) We have an issue with Digimap and Digimap for Schools both here – a nervousness that PDF is the same as “print”, people reluctant to generate PDFs. But we need to think about that.
Comment) How about just generating the PDF and showing that as the preview
A – Tom) That would be great but presupposes the user has Adobe Acrobat
Q) Is there anyway to make that connection between Roam and Data Download for OS Maps seamless?
A – Emma) The way that data download works is much more like that. We are not quite there yet but getting there.
Comment) When you purchase a map it appears to work in that way – it appears to work in that way, you click the picture and order the DWG.
A – Tom) We did wonder if providing DWG as a print format might be appropriate. They are things we are considering.
Q – Kami) How do you think about things like WMS rather than data download? Instead of download the accessing the data over the web via your GIS or tool. This is the general trend of Google, ESRI, etc. Probably makes sense to move towards that. And some industries may value those skills.
Comment – Shelley) I think that would be a lot easier actually.
A – Emma) We do have OpenStream… Data providers like this format and there is a move towards streaming data rather than downloads. We are working on this stuff.
FieldTrip GB Excursion – led by Addy Pope
This will be a slightly briefer live blog section as this is a hands on session trialling FieldTrip GB across the streets of Bloomsbury. Pictures illustrating the session will follow however.
Today we will be using FieldTrip GB to collect data and then we will come back here and visualise this data.
FieldTrip GB lets you collect georeferenced data – whether you have a data connection or whether you are somewhere remote where you will not be able to upload data until you return. FieldTrip GB works with a DropBox account to allow you to upload and share data. The mapping used is OS OpenData, OpenStreetMaps, and other open sources data all combined together, optimised for 4 inch screen and with rural coverage carefully considered. There is one mapping stack to make things easy and friendly across disciplines. This was a challenge as detail in urban and rural areas varies. But we have used Mapserver 6.2 Masking. It works brilliantly except when you are on a boundary between areas. It works well for most people but it’s unfortunate if your mapping area is always on the boundaries of those maps.
You can select an area and download data ahead of a fieldtrip. At the moment there is a limit of 3 x 15MB downloads – enough data for most of the greater London area or the whole of the Lake District. We are open to suggestions there though.
We have also created an authoring tool – here you can create your own forms for data collection which allow you to set up fields, mandatory or optional, you can provide hints for filling in those forms. The idea is that the forms should minimise effort in the field. You can collect data, use scales, include images etc. There are many options. And once your data is collected you can synch to Dropbox, you can use it, you can export it, and you can work on it.
So, for the complicated part. I will author a form, you will log into it, you will collect data, we will come back and visualise that data on Google Earth. It worked with the last group so fingers crossed. The last group collected pictures of bicycles – which was quite easy – what should we look at? Suggestion: Buildings and number of floors in said buildings. We will do that as a range, which will be a drop down box. And we can gather building fabric – a multi choice selector. And we will include an image capture.
So I have saved that. And that had synched to my dropbox account. So you will log in to that account and be able to access that form… and that having been done we shall head outside…
[cue a short excursion across Bloomsbury]
So, basically, that’s everything you need to do. The files just get synched to Dropbox. Then there is a record viewer in the Authoring tool. You can view the records, you can tweak the records, you can make any changes or corrections required here. You could change the picture – to a better angle for instance – but that’s trickier. It is probably better to create the extra point and delete the old one. The next thing to do is export our data. We will export as KML. And then just load it into Google Earth. You can then view the data and images.
So, in half an hour we have installed the app, used the app, edited the data and visualised the data. That’s not bad.
Q&A
Q) Does the date and time stamp carry with those records?
A) Yes, it is captured but we could expose that better.
Q) Is it UK only?
A) At the moment it is but we want to make it work globally but the issue is how best to do that. But we are considering Overlays which would let you connect up that mapping. But we wanted it to mirror the scope of Digimap – hence FieldTrip GB.
Closing Remarks – Emma Diffley, EDINA
Thank you so much for coming along, we know it’s a long way for some of you. We had some really interesting ideas from Shelley and her colleagues – we learned the phrase “BIM-ed up”. And myself and my colleagues really appreciated the opportunity to talk to you all during lunch time, to find out what you are doing. And I know we bang on about feedback but your feedback and comments are the best evidence to support and justify our existence. We really do appreciate that feedback.
And that’s #geoforum2013 finished. Huge thanks to all who came along in person and all who have been following online. We really appreciate your time and input.

![kim traynor [CC BY-SA 2.0 (http://creativecommons.org/licenses/by-sa/2.0)], via Wikimedia Commons](https://blogs.ed.ac.uk/digimap/wp-content/uploads/sites/6760/2016/08/University_building_Drummond_Street_-_geograph.org_.uk_-_1352882-1.jpg)

 We’d like to thank all the speakers and delegates at this years conference for taking part in a very successful event.
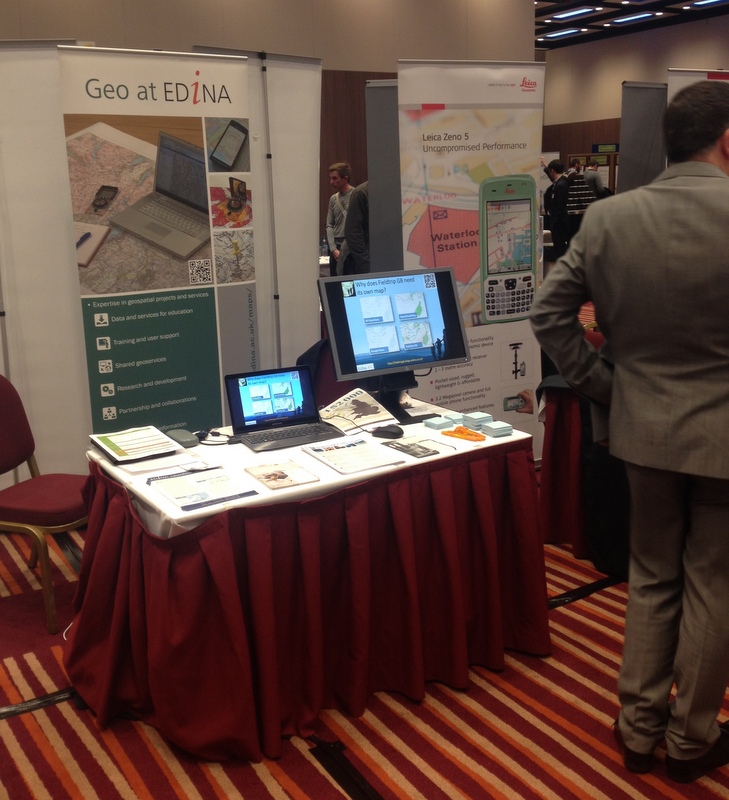
 Peter Gibbs is a well known for his BBC and Met Office weather forecasts and in his presentation he showed us the work that was being done by the Met Office and Environment Agency in combining their data and resources to predict not just where there is going to be rain but where the rain is likely to cause flooding.
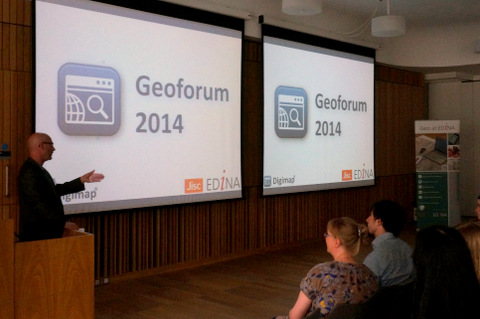


 EDINA’s Geoforum 2013 was a great success with over 50 academic and support staff attending four very well received presentations: