
For my reflection on the second half of this course, I am going to write about which particular activity we did in class that I felt I learnt the most from. I want to focus on the session in which Pilar Garcia de Leaniz came in and ran a session Visual Representation and Graphic Facilitation. This was a welcome change from our regular sessions for me, because although I find the meetings very intellectually stimulating and I always learn a lot from listening to the views of other group members, it is important to switch up the format of the sessions every so often to avoid stagnation. In this session we all were able to get out of our comfort zones and learn a new skill that was unfamiliar to virtually every member of the group beforehand, and this was a really refreshing change.
She began by explaining the benefits of representing information visually, rather than just as a block of text or speech; a large proportion of the population are considered to be visual thinkers, and far more information is retained if it has been visually represented rather than just aurally. Visual representation increases comprehension and clarity, improves engagement with content and makes learning/presenting/discussion more enjoyable and interesting both for audience and presenter. She explained the difference between graphic recording where the recorder is listening and synthesising information into a live capture visual representation, and graphic facilitation where a speaker uses pre-prepared graphics to support the delivery of information. Having the information collated into a piece of artwork is also beneficial once the talk is over, as the graphics can be looked over afterwards as a much more interesting way to revisit the information rather than a block of notes. From the visual notes, ideas can be refined and reflected upon, and graphics can be sent to others to pass on the information in a creative way.
She talked us through a few artistic methods that enable the graphic recorder/facilitator to present information in the most digestible way possible; lists, metaphors, scatter, clusters, landscapes and combinations. We talked a lot about using colours to make information clear and distinct, and that bold colours like red and orange should be used for titles and main points, cooler colours like blue and green are good for information and supporting graphics, using yellow creates eye-catching accents and black should be used rarely except for very important information. We practised drawing basic shapes in different colours, experimented with lettering and symbols, and how to use containers and connectors to organise and chronologise information when graphic recording. Throughout our practising, Pilar continuously reiterated that what we were doing was far removed from artistic ability, it was about information capture; you needed to be able to listen, synthesize and track information, skills that we all have as from attending lectures. Whether or not you think you can draw, you are used to processing information into notes, and this was employing the same skills to apply to what is essentially organised doodling.
Through repeatedly emphasising that artistic talent did not matter, she created an environment in which everyone was able to try their best at this new skill without feeling inhibited or self conscious about what it was that they were producing. This really allowed people to experiment without a sense of self-critique or judgement, and you could feel the group becoming palpably less self-conscious as the session went on and the graphic recordings produced from the readings we were discussing visibly improved. I found this incredibly rewarding, and it really allowed me to experiment doing something I enjoy so much and never find any time to do anymore. I did art throughout school until AS level, and always really enjoyed doodling and illustration, much to the frustration of my painting teacher. As is the way with mainstream education, choosing to drop art essentially signified the end of my drawing, as my life became overtaken with essays and readings and the like, and it had honestly been over two years since I’d spent time just drawing and experimenting with shapes and colours. Creative expression is a great outlet of stress for me, and over the years I’ve forgotten how much it can allow me to think outside the box and address problems from a different angle.
Having been reminded of the benefits of approaching information visually, I can think of lots of ways in which the workshop on graphic facilitation will help me in the future both inside and outside of this course. I work with a charity called People and Planet that runs environmental and social justice campaigns, and as part of this I help to run workshops and facilitate meetings. Although I do tend to use visual cues on flipchart paper when delivering workshops, I think taking on board the lessons about effective digital communication that I learnt in Pilar’s session will optimise the impact of the resources I use to support the information. Additionally, I have never considered taking minutes in People and Planet in any format other than written notes. Using graphic recording skills to note down what is discussed and to visually represent ideas could be a way of creating visual records that are easily accessible, digestible, and useful to look over to be reminded of what came up during meetings. Within this course, my group project on pedagogy will culminate in delivering a workshop on empowerment through learning, and we absolutely will be incorporating what we learnt in Pilar’s session when creating our supporting resources for this workshop.
I would like to add briefly that this was by no means the only activity or session from this course that I felt like I learnt from, as if that needs clarifying. This course has opened me up to new perspectives on educational methods and systems that I had never considered or even heard of beforehand, and I have been able to grow in confidence at voicing my own opinions as well as listening to and taking on board others in a way that is not doable in other more mainstream courses. I have actually particularly enjoyed entering discussions with management over the continuation of this course as this has not only exposed me first hand to the nightmarishly bureaucratic nature of university proceedings but has also given me an even stronger feeling of autonomy and control over my studies that goes further than simply having choice over curriculum, but over the structure and running of the course itself. That being said I chose to focus on Pilar’s session because of the way it reminded me of a hobby I had left dormant for too long, and was a refreshing and memorable change from our usual meeting proceedings.
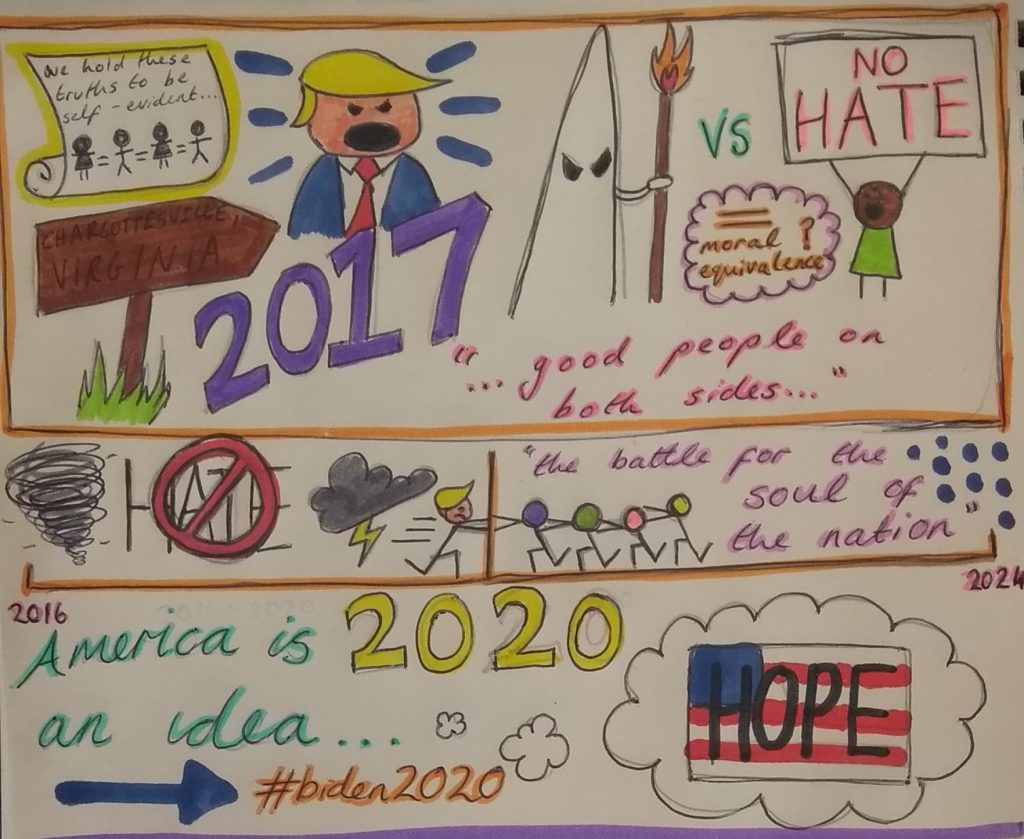
To supplement this reflection I want to put the skills I learnt during this session to practise by creating my own visual representation of some information. So I took something off of my twitter feed, Biden announcing his presidential candidacy (https://www.youtube.com/watch?time_continue=1&v=VbOU2fTg6cI), and tried to quickly record the topics he covered (Charlottesville, Trump and hope, primarily) visually. The result is below.
(NB: this is not a support/endorsement of Biden, just what I happened to find on twitter that day)


Thanks, Paula, for your thoughtful reflection. It helped me remember what was so novel about the workshop with Pilar, as well as recall some of the specifics of what she taught us. (In case anyone wants a reminder, Pilar’s slides are on this site in the relevant week.)
One of the implicit themes of your post is the value of having time to explore ways of working that don’t necessarily have an immediate outcome or link to an assignment. And imagine what might happen if, instead of an essay, you handed in a big sheet of paper on which you’d done a visual representation of the topic in question–let alone how online submission systems would (not) cope with that. But one can imagine that perhaps the visual representation might actually reflect deeper learning of the connections in the material than writing an essay.
It’s good you already have lots of ideas about how to apply your newly revived and stimulated graphic recording skills.
I wonder about the collective dimensions of this activity, which you didn’t really touch on. What did it do for us as a group to engage in this kind of activity together, and to put aside our inhibitions about not being able to draw while talking and thinking about ideas?
I think it would be great if in next year’s course we do this activity early on, and see how it contributes different approaches to working together when we are able to develop these skills and ways of representing our interactions and ideas over time.