
-
Project Background
The Edinburgh International Book Festival is a globally renowned literary event that gathers authors, publishers, and book enthusiasts.
The festival’s operational funding primarily comes from:
- Ticket sales (primarily through event ticketing)
- Corporate & individual sponsorships
- Charitable donations (the focus of this analysis)
With rising operational costs for cultural events, the sustainability of donations is crucial to the long-term development of the festival. This report analyzes donation data from 2023 and 2024, identifies changes in donation patterns, and provides optimization recommendations.
Data Scope: Donation trends, donor behavior, donation channels, and the impact of ticket sales on donations in 2023 and 2024
-
Overview of Donations
2023 vs 2024 Total Donation Comparison
| Year | Total Donation Amount (£) | Number of Donors | Change (%) |
| 2023 | 730,816.06 | 1,894 | Baseline |
| 2024 | 431,170.87 | 2,308 | -41.00% |
- The total donations in 2024 decreased by 41% compared to 2023, which could impact operations.
- The number of donors increased by 21.86%, indicating that more people were willing to donate, but the average donation amount per donor declined.
-
Key Insights Analysis
The following are the key insights derived from the donation data in 2023 and 2024. Each insight includes data, conclusions, and recommendations.
Analysis 1: Total Donations in 2024
Total Donations: £538,239.86
Donation Breakdown by Channel
| Channel | Donation Amount (£) | Percentage (%) |
| Counter (On-site) | 345.50 | 0.06% |
| Phone (Telephone Donations) | 35,691.49 | 6.63% |
| Web (Online Donations) | 214,137.98 | 39.79% |
| Postal (Mail Donations) | 288,064.89 | 53.52% |
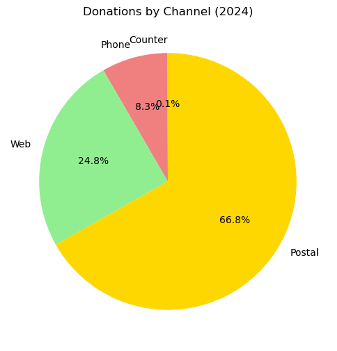 Key Findings:
- Mail donations (Postal) account for the highest percentage at over 53.5%, indicating that returning donors or subscription-based donations may be the primary source of contributions.
- Online donations (Web) account for 39.8%, showing that online giving is becoming a significant channel, though still trailing mail donations.
- Telephone donations (Phone) account for 6.6%, suggesting that this is a traditional but low-frequency donation method.
- On-site counter donations (Counter) are negligible at 0.06%, indicating that most visitors do not donate directly at physical locations.
Analysis 2: Distribution of Donation Amounts
- The majority of donations (90.06%) are less than £1, indicating that small donations are the dominant form of giving.
- Donations between £2 and £10 account for approximately 6.98%.
- Large donations (£100+) are rare, but significant donors still contribute high-value donations.
Detailed Distribution of Donations
| Donation Range (£) | Percentage (%) |
| < £1 | 90.06% |
| £1 – £2 | 0.31% |
| £2 – £5 | 4.62% |
| £5 – £10 | 2.04% |
| £10 – £50 | 2.43% |
| £50 – £100 | 0.16% |
| £100 – £500 | 0.25% |
| £500 – £1000 | 0.005% |
| £1000 – £5000 | 0.085% |
| £5000 – £10000 | 0.005% |
| £10000 – £50000 | 0.012% |
| £50000+ | 0.005% |
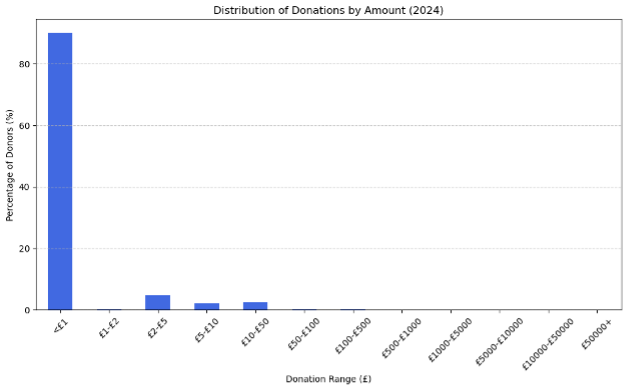
Key Findings:
- Most donations are small (£1 or less), but the overall donation total may still depend on a few high-value donors.
- High-value donations (£1000+) account for a very small percentage but contribute significantly to total funds.
- The £10-£50 range remains a crucial donation segment, accounting for 2.43%, and could be a potential growth area.
Analysis 3: Comparison of Top 10 Donors (2023 vs. 2024)
Total Contributions from Top 10 Donors
| Year | Top 10 Donors’ Total Contributions (£) | Percentage of Total Donations (%) |
| 2023 | 603,212.31 | 82.54% |
| 2024 | 332,015.00 | 77.00% |
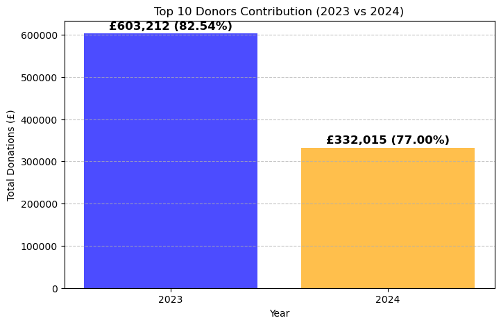
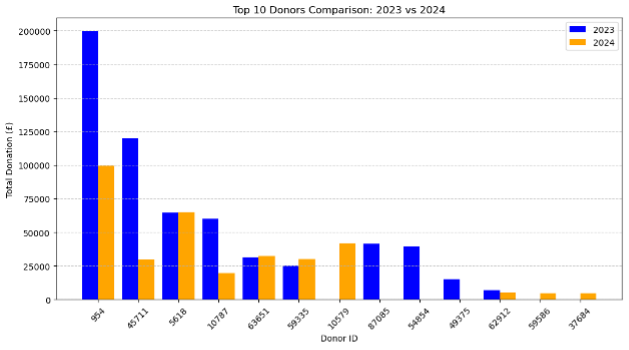
Key Findings:
- The top 10 donors still contribute the majority of total donations (over 75%), highlighting their critical impact.
- The total contributions from the top 10 donors in 2023 were 81% higher than in 2024, which is a major factor in the overall decline in donations.
- The highest individual donor (Donor ID: 954) reduced their donation by half in 2024 (from £199,520 to £99,520).
- Some major donors from 2023, such as Donor ID 87085, 54854, and 49375, are absent from the top 10 list in 2024.
Analysis 4: Changes in Donation Frequency (2023 vs. 2024)
Donation Frequency
| Metric | 2023 | 2024 | Change (%) |
| Average donation frequency (per donor) | 1.97 times | 1.96 times | -0.37% |
Key Findings:
- Donation frequency remains almost unchanged, with the average number of donations per donor in 2023 and 2024 being nearly identical.
- There is a slight decline in donation frequency (-0.37%), suggesting that most donors still donate only once rather than making recurring donations.
Analysis 5: Donation Trends by Month (2023 vs. 2024)
Monthly Donation Trends
| Month | 2023 Donations (£) | 2024 Donations (£) | Change (%) |
| January | 155,766.20 | 5,120.41 | -96.71% |
| February | 77,780.67 | 106,026.52 | +36.31% |
| March | 16,908.80 | 60,542.91 | +258.06% |
| April | 21,005.70 | 44,379.42 | +111.27% |
| May | 119,514.00 | 46,234.91 | -61.31% |
| June | 65,657.42 | 38,607.94 | -41.20% |
| July | 32,636.71 | 31,435.91 | -3.68% |
| August | 15,839.92 | 18,662.93 | +17.82% |
| September | 10,499.71 | 14,211.56 | +35.35% |
| October | 167,749.05 | 10,999.41 | -93.44% |
| November | 29,785.97 | 7,422.54 | -75.08% |
| December | 17,671.91 | 47,526.41 | +168.94% |
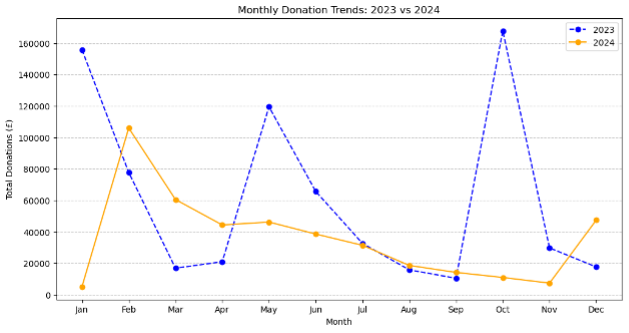
Key Findings:
- Donations in January, October, and November 2024 saw a significant decline, particularly:
- January (-96.71%)
- October (-93.44%)
- November (-75.08%)
- This may be due to fewer fundraising campaigns or reduced marketing efforts.
- Donations increased significantly in February, March, April, and December:
- March saw the highest growth (+258.06%).
- December also increased significantly (+168.94%).
- This suggests that special fundraising events or seasonal campaigns were effective during these months.
- The overall fluctuation in donations indicates that the fundraising schedule in 2024 differs significantly from 2023.
Analysis 6: Impact of Different Event Types on Donations (2023 vs. 2024)
Donation Comparison Data
| Event Type | 2023 Donations (£) | 2024 Donations (£) | Change (£) | Change (%) |
| DIGITAL_CATCHUP (Digital Replay) | £0.00 | £58,988.04 | +£58,988.04 | New Addition |
| PHYSICAL (In-Person Events) | £655,991.41 | £794,433.17 | +£138,441.76 | +21.10% |
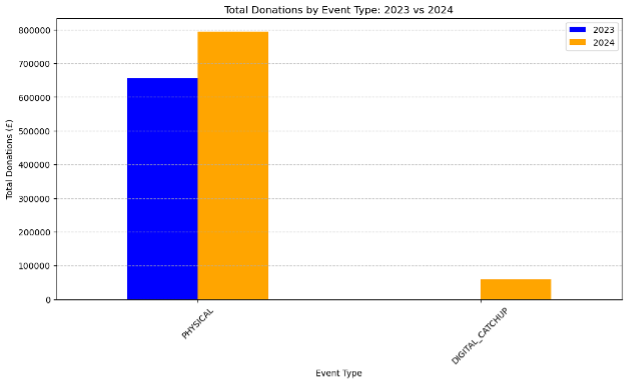
Key Findings:
- In-person events (PHYSICAL) remain the primary source of donations, with a 21.1% increase in 2024 compared to 2023, indicating that physical events continue to be a crucial fundraising channel.
- Digital replay (DIGITAL_CATCHUP) contributed £58,988.04 in 2024, a category that did not exist in 2023, suggesting that online replays may become a new fundraising opportunity.
- Online events (such as live streaming and replays) are gradually becoming part of the donation model, representing a potential growth area for future digital fundraising.
Analysis 7: High vs. Low-Donation Events
Top Donation Events
| Event Title | Total Donations (£) |
| The Front List: Matt Haig | 19,178.50 |
| The Front List: Richard Osman | 18,896.00 |
| The Front List: James O’Brien | 18,684.18 |
| The Front List: Alan Cumming & Forbes Masson | 18,121.43 |
| The Front List: Philippa Gregory | 17,029.00 |
| The Front List: Dolly Alderton | 14,427.08 |
| The Front List: Salman Rushdie | 14,352.50 |
| The Front List: Alice Oseman | 13,648.00 |
| On Making it Count: Oliver Burkeman | 5,499.50 |
| On Reflection: Richard Holloway | 5,412.00 |
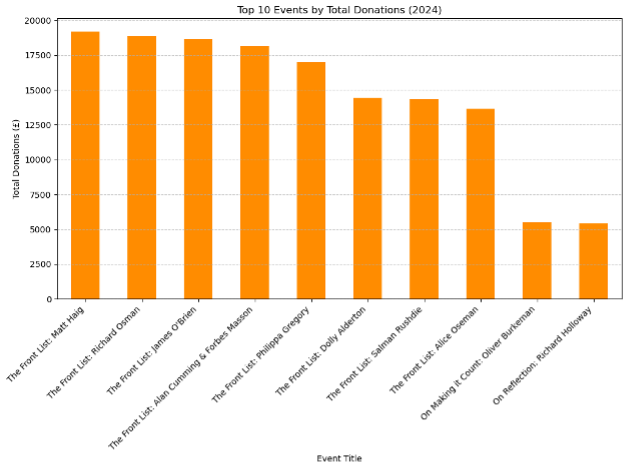
Key Findings
- Highest-donation events: “The Front List” series, with the top event generating £19,178.50.
- Lowest-donation events: Certain children’s events and some online events (SEE ONLINE EVENT) recorded £0.00 in donations.
- Conclusion: Some events have strong fundraising potential, while children’s and certain online events lack an effective donation mechanism.
- Recommendations:
- Enhance donation strategies for children’s events, such as parent sponsorship models.
- Optimize the fundraising process for online events to increase engagement and donation rates.
Analysis 8: New vs. Returning Donors
2024 New vs. Returning Donors
| Type | Number of Donors | Total Donations (£) |
| Returning Donors from 2023 | 980 | £325,789.00 |
| New Donors in 2024 | 1,328 | £105,381.87 |
Key Findings:
- New donors increased by 35% in 2024, but their total contribution was only £105,381.87, significantly lower than that of returning donors.
- Returning donors contribute substantially higher total donations, reinforcing the importance of donor retention.
- Targeted donor engagement strategies should be developed to increase the donation amounts from new donors.