Any views expressed within media held on this service are those of the contributors, should not be taken as approved or endorsed by the University, and do not necessarily reflect the views of the University in respect of any particular issue.

Conclusion and Recommendations for Enhancing Donations at the Edinburgh International Book Festival

Overall Conclusion

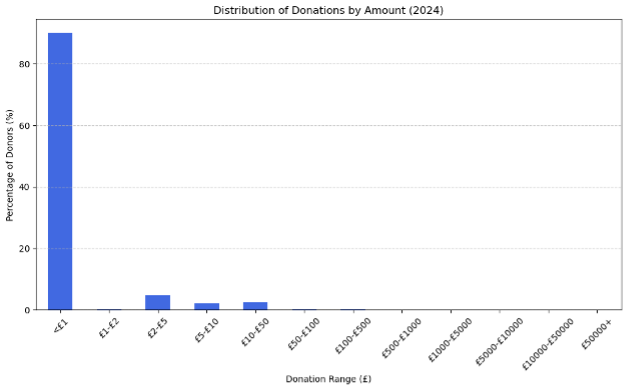
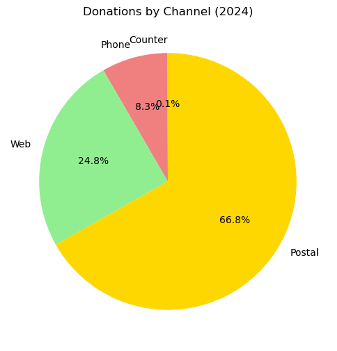
The donation analysis for the Edinburgh International Book Festival in 2024 reveals key trends in donor behavior, fundraising channels, and event-driven contributions. The total donations for 2024 amounted to £538,239.86, distributed across different channels, with postal donations (53.52%) and online donations (39.79%) being the primary sources. Small donations, particularly those under £1, dominate in volume but contribute less to the overall funds, while high-value donations from a small group of donors remain crucial to the festival’s financial health.

Comparing donation trends between 2023 and 2024, several critical observations emerge:

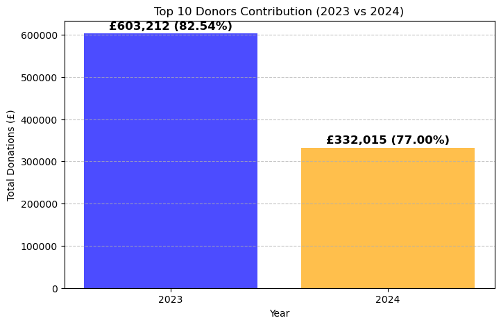
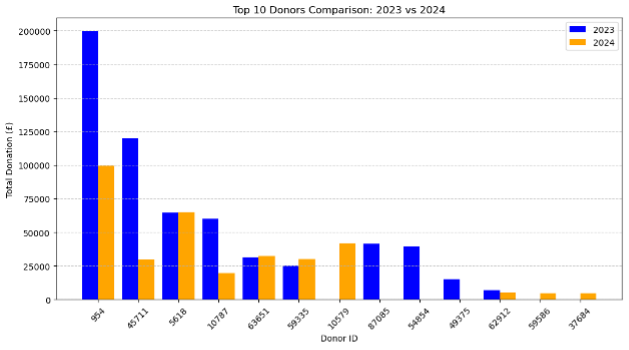
  1. A decline in total contributions from the top 10 donors (down from £603,212.31 in 2023 to £332,015.00 in 2024) suggests that major donor retention is a challenge. The absence of some high-value donors from previous years has significantly impacted total fundraising.
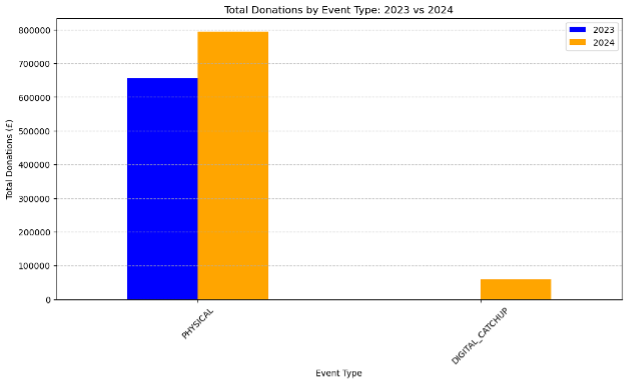
  2. In-person events remain the strongest fundraising avenue, with donations increasing by 21.1% year-over-year. This suggests that live events offer an effective platform for engaging donors and encouraging contributions.
  3. The introduction of digital replay donations (DIGITAL_CATCHUP) contributed £58,988.04, a promising new revenue stream. This indicates that digital engagement could play a larger role in future fundraising.
  4. Donation frequency per donor remained largely unchanged, implying that most donors contribute only once per year. Encouraging repeat donations through sustained engagement strategies is a key area for improvement.
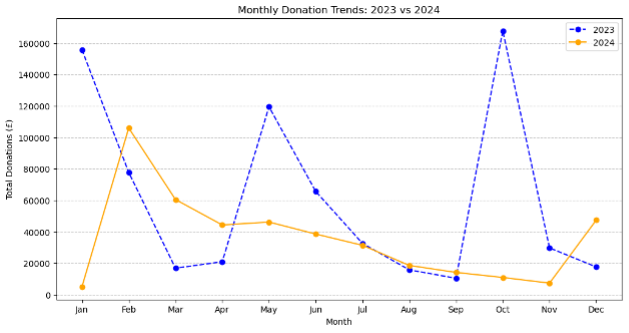
  5. Fluctuations in monthly donation trends suggest that fundraising efforts were not evenly distributed across the year. Significant drops in January (-96.71%) and October (-93.44%) highlight periods of weak engagement, whereas spikes in March (+258.06%) and December (+168.94%) indicate successful seasonal or event-driven campaigns.
  6. New donors increased by 35% in 2024, but their average contribution was significantly lower than that of returning donors. This suggests that while outreach efforts successfully attracted new donors, retention and engagement strategies need to be improved to convert them into long-term supporters.
  7. Not all events contribute equally to fundraising. The “Front List” series proved highly effective in generating donations, whereas children’s events and some online events received little to no financial support.

To build on these findings, the festival should adopt a multi-faceted donation strategy that strengthens donor retention, expands digital fundraising, and optimizes fundraising opportunities across all event types.

Recommendations and Fundraising Strategies

1. Strengthening Major Donor Retention

  • Personalized Engagement: High-value donors play a disproportionately large role in total contributions. Implementing a dedicated donor relationship management program that includes personalized thank-you messages, exclusive event invitations, and tailored engagement plans can help retain and grow this segment.
  • Exclusive Recognition and Benefits: Introduce “Patron Circles” or VIP tiers that offer perks such as exclusive author meet-and-greet sessions, premium seating, and behind-the-scenes festival access to encourage repeat and larger donations.
  • Matching Gift Campaigns: Partner with corporate sponsors to offer matching donations for high-value contributors, effectively doubling the impact of their contributions.

2. Enhancing Small and Mid-Level Donor Engagement

  • Optimized Suggested Donation Tiers: As 90.06% of donations are under £1, implementing a structured tiered donation system (e.g., £2, £5, £10 as default choices) can help increase the average contribution per donor.
  • Gamification and Incentives: Introduce a “Supporter Badge” system, where donors receive digital or physical recognition for reaching cumulative donation milestones.
  • Recurring Giving Options: Encourage donors to sign up for monthly giving programs by highlighting the long-term impact of their support and offering small perks for participation.

3. Expanding Digital and Online Fundraising

  • Enhance Digital Replay Monetization: Given that DIGITAL_CATCHUP raised £58,988.04 despite being a new initiative, further investment in paywall options, donation prompts before accessing content, or exclusive replay content for donors can significantly increase this revenue stream.
  • Live Donation Appeals During Events: Implement real-time fundraising drives during online events, with visible donation progress bars and live acknowledgments for contributors.
  • Social Media Donation Challenges: Run targeted digital fundraising campaigns, such as “30 Days of Reading – Support the Festival”, encouraging donors to participate and share their contributions on social platforms.

4. Optimizing Event-Based Fundraising Strategies

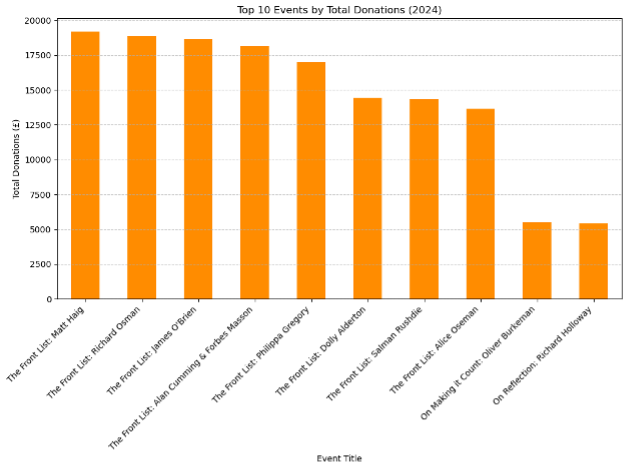
  • Leverage High-Performing Events: Events such as the “Front List” series generated significant donations (up to £19,178.50 per session). These events should be expanded with dedicated fundraising messaging and premium donation incentives.
  • Improve Fundraising for Children’s and Online Events: Children’s events received minimal donations. Adding a “Parent Sponsorship” model, where parents can contribute to literacy programs or subsidized tickets for disadvantaged children, could bridge this gap.
  • Festival-Wide Fundraising Integration: Ensure that every festival event includes a donation pitch at the beginning or end, with clear instructions on how to give.

5. Timing and Campaign Planning

  • Address Seasonal Donation Drops: The steep declines in donations during January, October, and November indicate gaps in fundraising efforts. Introducing winter fundraising campaigns, anniversary fundraising drives, or pre-event donation challenges could help smooth out donation volatility.
  • Leverage Successful Seasonal Spikes: Since March and December showed strong donation surges, running complementary early-bird fundraising initiatives, holiday-themed giving campaigns, or exclusive seasonal perks could further maximize revenue.

Final Thoughts

The Edinburgh International Book Festival has a unique opportunity to optimize its fundraising strategy by leveraging event-driven donations, expanding digital engagement, and strengthening donor retention efforts. While in-person events remain the primary driver of contributions, digital replay donations offer a promising new revenue stream. Addressing disparities in event-based fundraising, refining seasonal donation strategies, and enhancing engagement for both high-value and small donors will be key to ensuring long-term financial sustainability and growth.

By implementing these targeted strategies, the festival can increase donor retention, boost donation amounts across all levels, and future-proof its fundraising efforts in an evolving digital landscape.

Edinburgh International Book Festival 2023-2024 Donation Analysis

  1. Project Background

The Edinburgh International Book Festival is a globally renowned literary event that gathers authors, publishers, and book enthusiasts.

The festival’s operational funding primarily comes from:

  • Ticket sales (primarily through event ticketing)
  • Corporate & individual sponsorships
  • Charitable donations (the focus of this analysis)

With rising operational costs for cultural events, the sustainability of donations is crucial to the long-term development of the festival. This report analyzes donation data from 2023 and 2024, identifies changes in donation patterns, and provides optimization recommendations.

Data Scope: Donation trends, donor behavior, donation channels, and the impact of ticket sales on donations in 2023 and 2024


  1. Overview of Donations

2023 vs 2024 Total Donation Comparison

Year Total Donation Amount (£) Number of Donors Change (%)
2023 730,816.06 1,894 Baseline
2024 431,170.87 2,308 -41.00%
  • The total donations in 2024 decreased by 41% compared to 2023, which could impact operations.
  • The number of donors increased by 21.86%, indicating that more people were willing to donate, but the average donation amount per donor declined.


  1. Key Insights Analysis

The following are the key insights derived from the donation data in 2023 and 2024. Each insight includes data, conclusions, and recommendations.


Analysis 1: Total Donations in 2024

Total Donations: £538,239.86

Donation Breakdown by Channel

Channel Donation Amount (£) Percentage (%)
Counter (On-site) 345.50 0.06%
Phone (Telephone Donations) 35,691.49 6.63%
Web (Online Donations) 214,137.98 39.79%
Postal (Mail Donations) 288,064.89 53.52%

Key Findings:

  • Mail donations (Postal) account for the highest percentage at over 53.5%, indicating that returning donors or subscription-based donations may be the primary source of contributions.
  • Online donations (Web) account for 39.8%, showing that online giving is becoming a significant channel, though still trailing mail donations.
  • Telephone donations (Phone) account for 6.6%, suggesting that this is a traditional but low-frequency donation method.
  • On-site counter donations (Counter) are negligible at 0.06%, indicating that most visitors do not donate directly at physical locations.


Analysis 2: Distribution of Donation Amounts

  • The majority of donations (90.06%) are less than £1, indicating that small donations are the dominant form of giving.
  • Donations between £2 and £10 account for approximately 6.98%.
  • Large donations (£100+) are rare, but significant donors still contribute high-value donations.

Detailed Distribution of Donations

Donation Range (£) Percentage (%)
< £1 90.06%
£1 – £2 0.31%
£2 – £5 4.62%
£5 – £10 2.04%
£10 – £50 2.43%
£50 – £100 0.16%
£100 – £500 0.25%
£500 – £1000 0.005%
£1000 – £5000 0.085%
£5000 – £10000 0.005%
£10000 – £50000 0.012%
£50000+ 0.005%


Key Findings:

  • Most donations are small (£1 or less), but the overall donation total may still depend on a few high-value donors.
  • High-value donations (£1000+) account for a very small percentage but contribute significantly to total funds.
  • The £10-£50 range remains a crucial donation segment, accounting for 2.43%, and could be a potential growth area.


Analysis 3: Comparison of Top 10 Donors (2023 vs. 2024)

Total Contributions from Top 10 Donors

Year Top 10 Donors’ Total Contributions (£) Percentage of Total Donations (%)
2023 603,212.31 82.54%
2024 332,015.00 77.00%

Key Findings:

  • The top 10 donors still contribute the majority of total donations (over 75%), highlighting their critical impact.
  • The total contributions from the top 10 donors in 2023 were 81% higher than in 2024, which is a major factor in the overall decline in donations.
  • The highest individual donor (Donor ID: 954) reduced their donation by half in 2024 (from £199,520 to £99,520).
  • Some major donors from 2023, such as Donor ID 87085, 54854, and 49375, are absent from the top 10 list in 2024.


Analysis 4: Changes in Donation Frequency (2023 vs. 2024)

Donation Frequency

Metric 2023 2024 Change (%)
Average donation frequency (per donor) 1.97 times 1.96 times -0.37%

Key Findings:

  • Donation frequency remains almost unchanged, with the average number of donations per donor in 2023 and 2024 being nearly identical.
  • There is a slight decline in donation frequency (-0.37%), suggesting that most donors still donate only once rather than making recurring donations.


Analysis 5: Donation Trends by Month (2023 vs. 2024)

Monthly Donation Trends

Month 2023 Donations (£) 2024 Donations (£) Change (%)
January 155,766.20 5,120.41 -96.71%
February 77,780.67 106,026.52 +36.31%
March 16,908.80 60,542.91 +258.06%
April 21,005.70 44,379.42 +111.27%
May 119,514.00 46,234.91 -61.31%
June 65,657.42 38,607.94 -41.20%
July 32,636.71 31,435.91 -3.68%
August 15,839.92 18,662.93 +17.82%
September 10,499.71 14,211.56 +35.35%
October 167,749.05 10,999.41 -93.44%
November 29,785.97 7,422.54 -75.08%
December 17,671.91 47,526.41 +168.94%

Key Findings:

  1. Donations in January, October, and November 2024 saw a significant decline, particularly:
    • January (-96.71%)
    • October (-93.44%)
    • November (-75.08%)
    • This may be due to fewer fundraising campaigns or reduced marketing efforts.
  2. Donations increased significantly in February, March, April, and December:
    • March saw the highest growth (+258.06%).
    • December also increased significantly (+168.94%).
    • This suggests that special fundraising events or seasonal campaigns were effective during these months.
  3. The overall fluctuation in donations indicates that the fundraising schedule in 2024 differs significantly from 2023.

Analysis 6: Impact of Different Event Types on Donations (2023 vs. 2024)

Donation Comparison Data

Event Type 2023 Donations (£) 2024 Donations (£) Change (£) Change (%)
DIGITAL_CATCHUP (Digital Replay) £0.00 £58,988.04 +£58,988.04 New Addition
PHYSICAL (In-Person Events) £655,991.41 £794,433.17 +£138,441.76 +21.10%

Key Findings:

  1. In-person events (PHYSICAL) remain the primary source of donations, with a 21.1% increase in 2024 compared to 2023, indicating that physical events continue to be a crucial fundraising channel.
  2. Digital replay (DIGITAL_CATCHUP) contributed £58,988.04 in 2024, a category that did not exist in 2023, suggesting that online replays may become a new fundraising opportunity.
  3. Online events (such as live streaming and replays) are gradually becoming part of the donation model, representing a potential growth area for future digital fundraising.


Analysis 7: High vs. Low-Donation Events

Top Donation Events

Event Title Total Donations (£)
The Front List: Matt Haig 19,178.50
The Front List: Richard Osman 18,896.00
The Front List: James O’Brien 18,684.18
The Front List: Alan Cumming & Forbes Masson 18,121.43
The Front List: Philippa Gregory 17,029.00
The Front List: Dolly Alderton 14,427.08
The Front List: Salman Rushdie 14,352.50
The Front List: Alice Oseman 13,648.00
On Making it Count: Oliver Burkeman 5,499.50
On Reflection: Richard Holloway 5,412.00

Key Findings

  • Highest-donation events: “The Front List” series, with the top event generating £19,178.50.
  • Lowest-donation events: Certain children’s events and some online events (SEE ONLINE EVENT) recorded £0.00 in donations.
  • Conclusion: Some events have strong fundraising potential, while children’s and certain online events lack an effective donation mechanism.
  • Recommendations:
    • Enhance donation strategies for children’s events, such as parent sponsorship models.
    • Optimize the fundraising process for online events to increase engagement and donation rates.


Analysis 8: New vs. Returning Donors

2024 New vs. Returning Donors

Type Number of Donors Total Donations (£)
Returning Donors from 2023 980 £325,789.00
New Donors in 2024 1,328 £105,381.87

Key Findings:

  • New donors increased by 35% in 2024, but their total contribution was only £105,381.87, significantly lower than that of returning donors.
  • Returning donors contribute substantially higher total donations, reinforcing the importance of donor retention.
  • Targeted donor engagement strategies should be developed to increase the donation amounts from new donors.


How to Optimize Donations for the Edinburgh International Book Festival? – Research Approach

Before analyzing how to enhance donation strategies for the Edinburgh International Book Festival, we first need to organize and understand the five datasets available and establish a comprehensive analytical framework. This article outlines the data processing steps and key analytical directions, laying the foundation for further exploration of donation patterns.

  1. Data Structure & Cleaning

The five datasets include event details, revenue, donations, audience data, and transaction records. Before analysis, we must perform data preprocessing to ensure completeness, consistency, and correct relationships between different datasets.

Key Data Processing Steps:

  1. Standardizing Data Formats:
    • Ensure all date fields follow a consistent format (e.g., YYYY-MM-DD).
    • Identify and align currency values across different datasets to maintain comparability.
  2. Deduplication & Data Integration:
    • Are donations recorded separately from transactions?
      • If so, we must distinguish donation_amount from ticket_revenue to prevent double counting.
    • Can each transaction be linked to a specific event?
      • transactions_2024 (event transactions) and income_2024 (daily income) must be correctly mapped to ensure donations are attributed to the right events.
  3. Handling Outliers & Missing Data:
    • Negative ticket revenue or refunds—do they impact donation calculations?
    • Are there large one-time donations that could skew the overall trends?
  1. Key Analytical Directions

After data cleaning, the analysis will focus on donation behavior patterns to identify the key factors influencing donations. The framework includes the following four core areas:

  1. Donation Trends Over Time
  • Objective: Identify donation peaks & lows, assessing variations over different time periods.
  • Methods:
    • Compare 2023 & 2024 daily income trends to determine year-over-year donation changes.
    • Identify whether specific dates (e.g., festival opening, closing, or specific author talks) correlate with donation spikes.
  1. Online vs. Offline Donation Analysis
  • Objective: Assess the effectiveness of different donation channels (Web, Phone, Postal, Counter) and their contributions.
  • Methods:
    • Calculate total donations & contribution ratios by channel to find the most effective fundraising medium.
    • Analyze conversion rates of online viewers donating, identifying the potential for increasing digital contributions.
  1. Impact of Events & Guest Speakers on Donations
  • Objective: Identify which events or guest speakers generate the highest donation amounts to inform future programming.
  • Methods:
    • Calculate ticket revenue vs. total donations for each event, evaluating the fundraising potential of different event formats.
    • Assess whether high-profile authors or speakers significantly influence donation behavior.
  1. Audience Donation Behavior Analysis
  • Objective: Understand the characteristics of donors to refine fundraising strategies.
  • Methods:
    • Categorize donations into ranges (£0-5, £5-10, £10-50, etc.) to compare small vs. high-value donations.
  1. Expected Research Outcomes

By following this analytical approach, we aim to answer the following key questions:

  1. When do donations peak? Are there recurring fundraising patterns?
  2. Do online or offline audiences donate more?
  3. Which events or speakers attract the highest donations? Can we replicate successful models?
  4. Do most donations come from small donors or high-net-worth individuals?
  5. Can donation strategies be adjusted to improve overall fundraising rates?

This research aims to use data-driven insights to optimize the Edinburgh International Book Festival’s donation model and provide actionable fundraising recommendations.

css.php

Report this page

To report inappropriate content on this page, please use the form below. Upon receiving your report, we will be in touch as per the Take Down Policy of the service.

Please note that personal data collected through this form is used and stored for the purposes of processing this report and communication with you.

If you are unable to report a concern about content via this form please contact the Service Owner.

Please enter an email address you wish to be contacted on. Please describe the unacceptable content in sufficient detail to allow us to locate it, and why you consider it to be unacceptable.
By submitting this report, you accept that it is accurate and that fraudulent or nuisance complaints may result in action by the University.

  Cancel