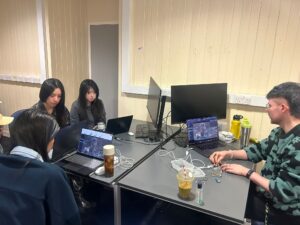
- Group Progress Report
- Presented the current progress of the group, including data collection, interaction design, and installation structure.
- Discussed the application of different sensors (temperature, volume, PPG, etc.) in data visualization.
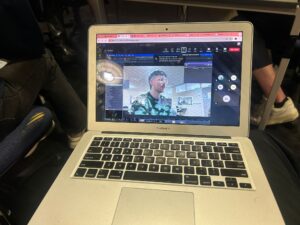
- Arduino Workshop
- Philly conducted sensor testing and successfully connected Arduino with Touch Designer.
- Successfully tested the light sensor and potentiometer, confirming smooth data transmission to Touch Designer.
- Discussed ways to optimize data filtering and smoothing to reduce fluctuations and interference.
- Submission 1 Arrangement
- Submission Deadline: February 12
- Submission Content:
- Group Proposal: Jointly written by team members.
- Individual Blog Updates: Each member must submit independent records of experiments, research progress, etc.
- Requirements:
- The proposal must include interaction logic, visual design, sound design, and installation plans.
- The individual blog content should document the experimental process and technical explorations to ensure grading standards are met.
- Visual Direction & Installation Concepts
- Team members presented initial concepts for visual style and installation
- Visual Design Reference: ref1,ref2
Installation FB is on this post
- Philly’s Feedback
- Sensor Data Processing:
- Temperature sensor may require a higher precision device or an added resistor to optimize readings.
- Audio data could be combined with microphone data to enhance the interactive experience.
- Interaction Method Suggestions:
- Use a handheld microphone + sensor instead of a mask to avoid hygiene concerns.
- Place sensors close to the user’s mouth to improve breathing detection accuracy.
- Installation Space Selection:
- Consider using ECA spaces or the Futures Institute for installation. Some ECA rooms are enclosed, making them suitable for an immersive experience.
- Sensor Data Processing: