Sensor Category
In the first half of the semester, I tried many kinds of sensors in the Grove sensor kit, such as light sensor, sound sensor, air quality sensor, etc. But then it turned out that some of the sensors did not work with our installation. For example, the sound sensor needs to receive sounds above a certain sound pressure level before it changes its value. However, our project is an immersive audio-visual installation. If users keep making sounds to interact with the sound sensor, first of all, it will affect the immersion. Secondly, the sound sensor itself will also receive the sound in the installation, thus reducing the user’s interactivity. Therefore, after constant attempts, I finally chose 2 ultrasonic sensors, 2 light sensors and a temperature&humidity sensor that have obvious numerical changes and are very suitable for our installation.
Among them, the ultrasonic sensor and light sensor are more convenient to operate. Their easy-to-operate feature is very suitable for parameters that require obvious changes. So I used them together to change the sound panning and visual parts.
The ultrasonic sensor changes the value generated by the change in the distance between the object and it (see Figure 1). Users can interact with it by moving their hands closer or farther away from it to change the distance to it. The greater the distance, the greater the value it generates, and vice versa. Generally, the distance range that it can receive in real time is between 0 and 500, but the actual more sensitive part when people interact with it is between 0 and 50. I use it as a controller to change the X-axis value of the sound and music panner and change the visual pattern types.
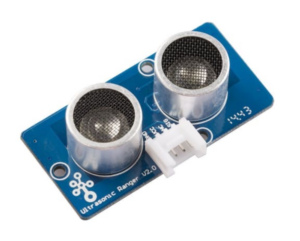
Figure 1: Ultrasonic Sensor.
The light sensor changes the generated value based on the different brightness received (see Figure 2). Users can use the flashlight in the mobile phone to shine on it to control its numerical changes. The greater the brightness, the higher the value, and vice versa. Usually the range of values is approximately between 0 and 750. So corresponding to the ultrasonic sensor, I use it to control the Y-axis value of the panner for sound and music and the complexity value of the visual pattern.
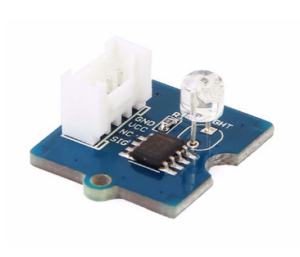
Figure 2: Light Sensor.
The temperature&humidity sensor can receive two values of temperature and humidity (see Figure 3). Users can change its value by heating it with their hands or blowing on it.
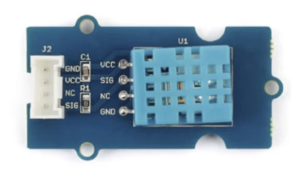
Figure 3: Temperature&Humidity Sensor.
Similarly, the higher the temperature or humidity received, the greater the corresponding value. But what is special is that the temperature usually changes slowly, ranging between 23 and 28; while the humidity changes quickly and in a large range, usually between 35 and 100. So I used the temperature and humidity values to control two different types of parameters respectively.
Temperature value is used to invisibly control the overall volume of the installation. Because sound levels increase when there are more people in the environment, this may result in some people not being able to hear the sound in the installation. The characteristic of not changing significantly in temperature is suitable for improving this. That is, the more people there are, the higher the temperature, and the greater the master sound level of the installation.
The humidity value that changes significantly is used to control the cutoff frequency of the sound filter. Obvious filter changes are very helpful to enhance interest.
Setup
On site, our interactive devices are placed on a table in the middle of the Atrium (see Figure 4). Users need to walk up to the table to interact with the installation. With four speakers placed around it, users can feel an immersive experience in the center.
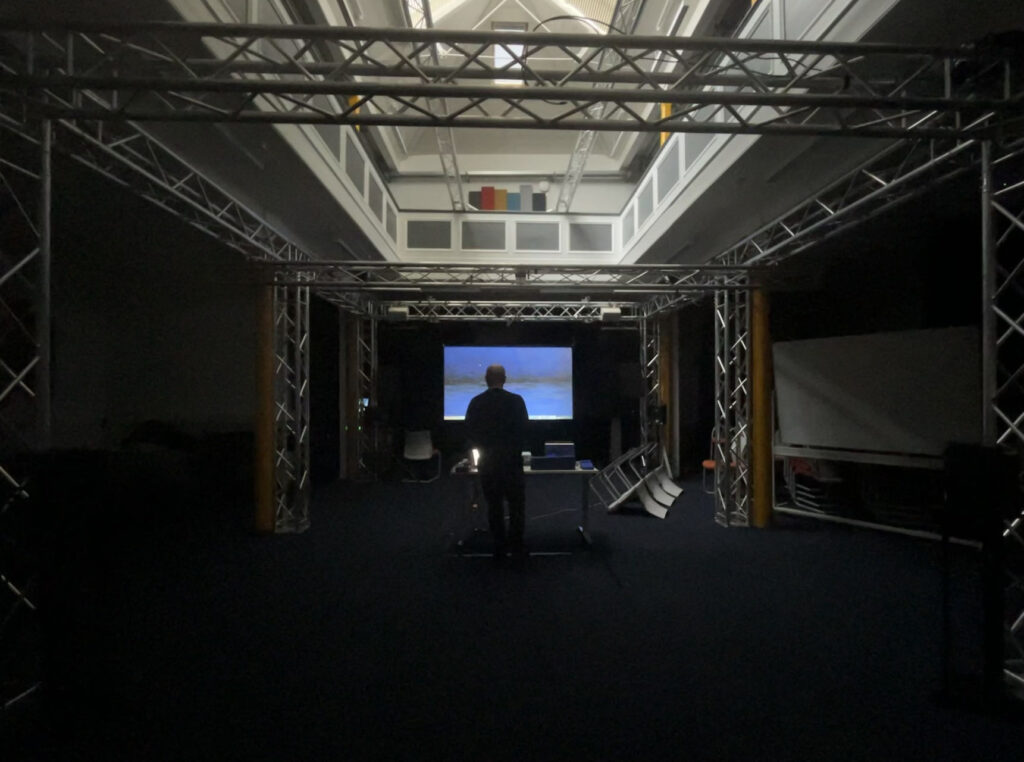
Figure 4: Location of Tables for Interactive Media.
The placement on the table is based on Jules’ suggestion, placing the two sensor boxes, Audio and Visual, in columns so that the sound and visual sensors could be interacted with at the same time, strengthening the connection between audio and vision. The MIDI controller is placed on the right side of the sensor to facilitate users to switch to the next layer (see Figure 5).
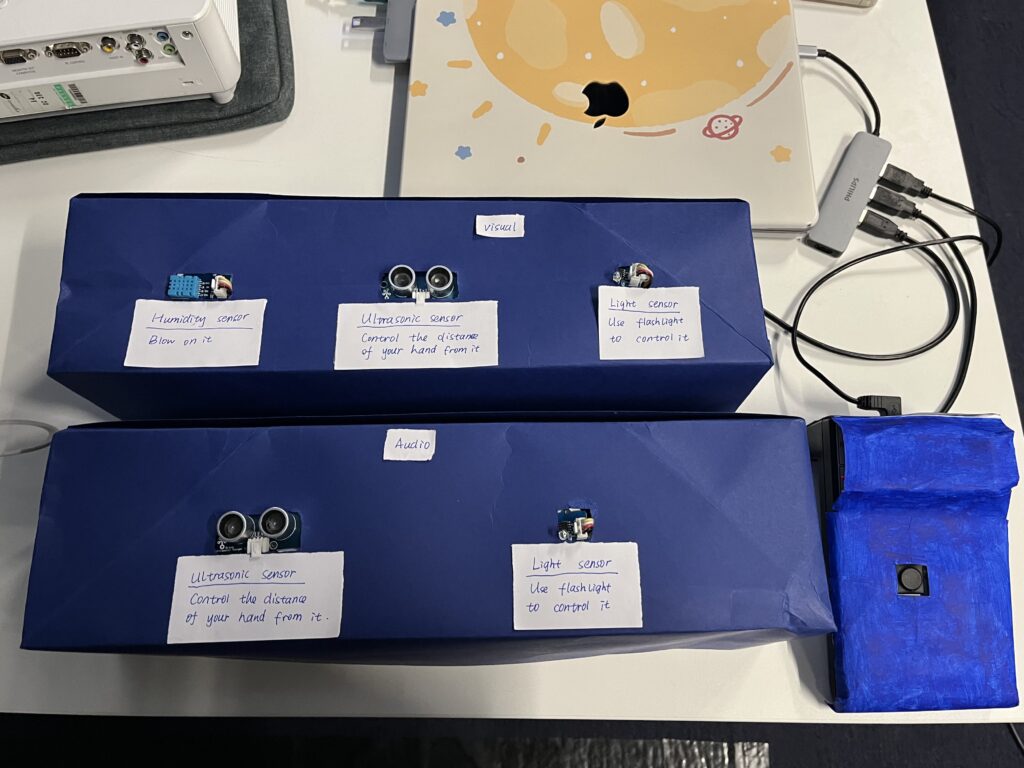
Figure 5: The Placement of Interactive Media.