Subtitle:
— A Visual Documentation of Spatial Reconstruction Using Leica G1, TouchDesigner, and Audio-Driven Interaction
Ren Yuheng | s2593996
1. Scanning the Paper Factory
1.1 Preparing and Learning Leica G1
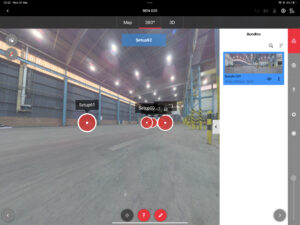
Before fieldwork, I spent time learning how to operate the Leica BLK G1 scanner, especially in conjunction with the Field 360 iPad app. This included planning scans, understanding bundle optimisation, using Quick-Link features, and managing live positioning feedback on-site.
1.2 Scanning Strategy Design
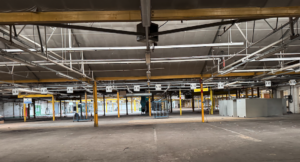
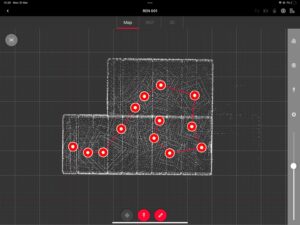
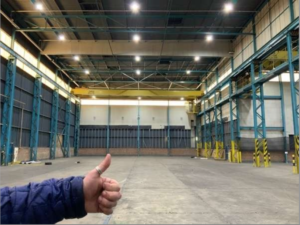
The scanning site—a decommissioned paper factory—comprised two interconnected rectangular volumes with varied interior heights and several hidden corners.
To minimise blind spots and ensure comprehensive spatial data capture, I designed a closed-loop scanning path focused along the longer edge of the building.
We decided on 13 scan positions, arranged in a clockwise circuit, each overlapping with at least two neighbours to ensure successful registration.
Choosing scan positions involved balancing structural visibility, minimal obstructions, and alignment feasibility.
1.3 On-Site Execution
On location, I carried out the scanning process with both precision and flexibility.
For each station, I carefully placed the scanner at optimal height, avoiding glass surfaces, light reflections, or metal interference.
After each scan, the Field 360 app allowed me to visually confirm if links were successful.
If the overlap was too low or bundle errors occurred, I manually removed the failed scan and rescanned the segment.
This hands-on control significantly reduced errors in post-registration
2. Point Cloud Processing and Data Export
2.1 Import and Registration
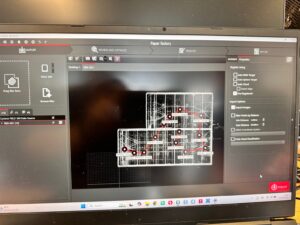
Following data capture, I transferred all .blk files into Cyclone Register 360, Leica’s dedicated point cloud processing software.
There, each scan was imported as a node in a global project and automatically aligned using visual linking.
Although the software provides semi-automated tools, I manually refined several connections, especially in corners where reflections or low overlap caused slight drift.
I also ensured that each scan had at least three strong links to neighbouring positions, meeting Leica’s recommended bundle criteria.
2.2 Quality Review with Leica Report
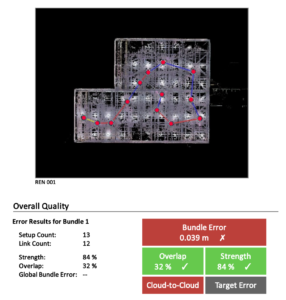
The Leica system generates a detailed registration report.
For our factory scans, the bundle had 13 setups and 12 links, with an overall strength of 84% and overlap of 32%.
Though a few links showed slightly high errors (0.04–0.06m), the final result was within acceptable bounds.
2.3 Cleaning and Exporting
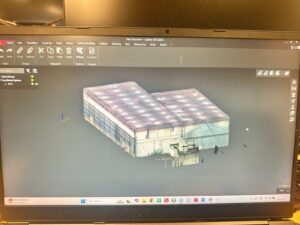
Point cloud data, while rich in detail, often includes unwanted geometry: moving objects, noisy surfaces, or repeated elements.
I used Cyclone’s edit tools to segment the environment into logical areas—floors, ceilings, support beams—and removed unnecessary background data.
This cleaning process improved clarity, reduced processing load, and prepared the model for visualisation.
Finally, I exported the processed cloud in .XYZ format, which preserved each point’s XYZ coordinates and colour values (RGB) for later use.
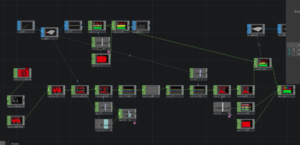
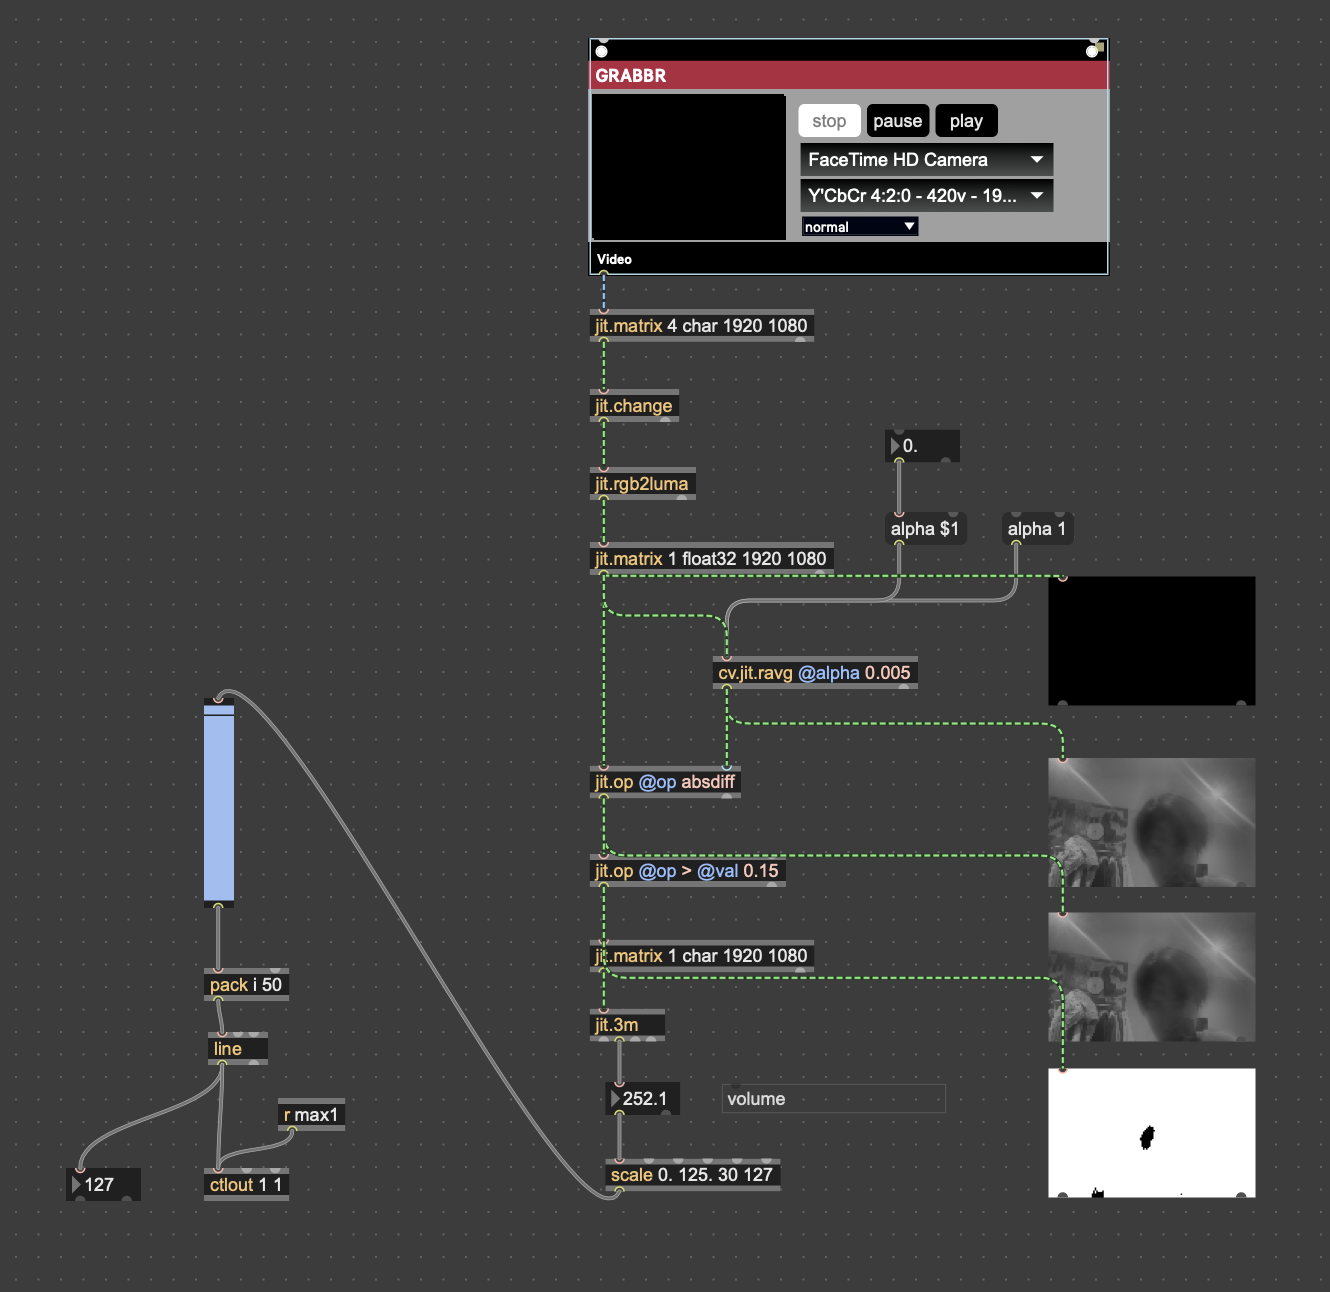
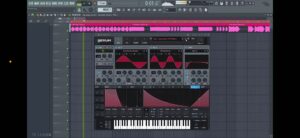
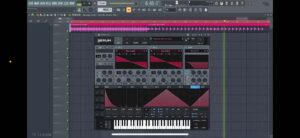
3. Visualisation in TouchDesigner
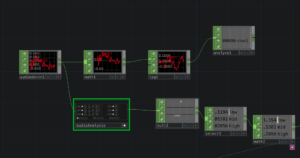
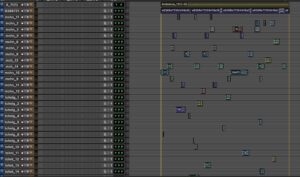
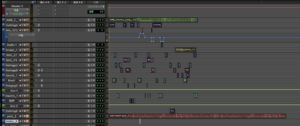
3.1 Building a Modular Visual System
Given the density of the point cloud, I created two main patches in TouchDesigner:
-
One to manage spatial position data (XYZ)
-
One to control colour and brightness attributes (RGB)
This modular approach allowed for better real-time control and visual efficiency. 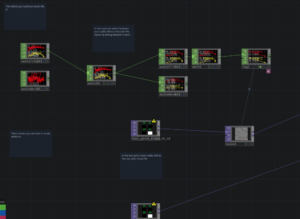
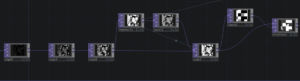
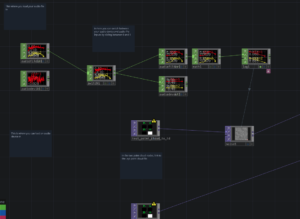
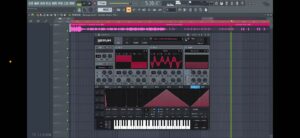
3.2 Connecting with Audio Input
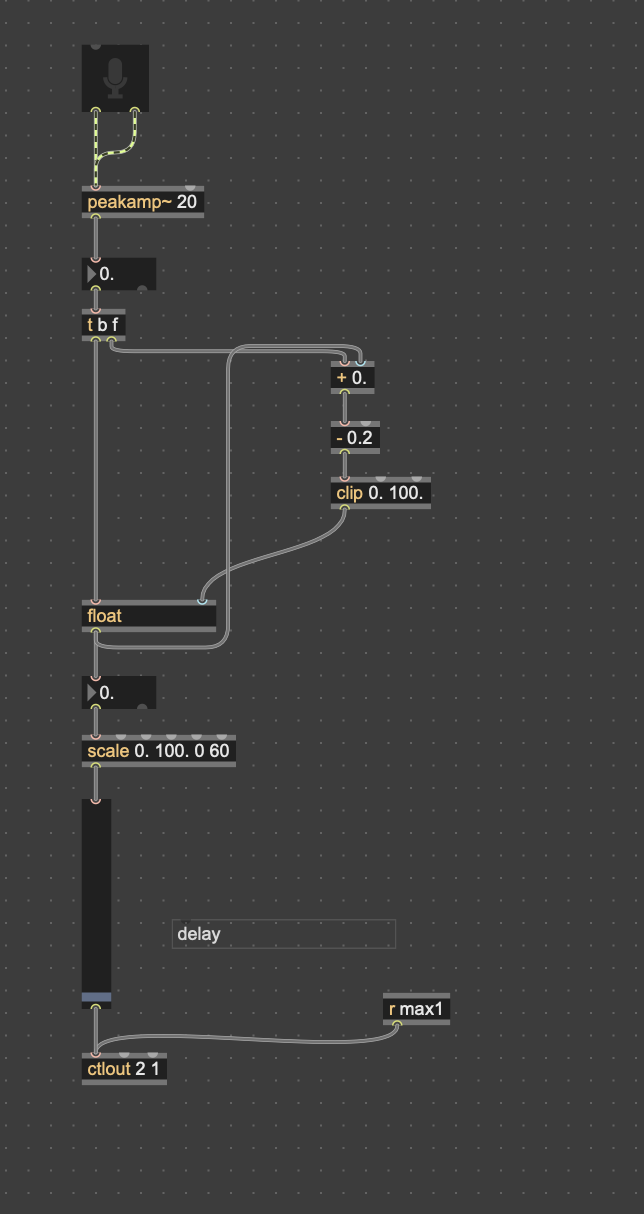
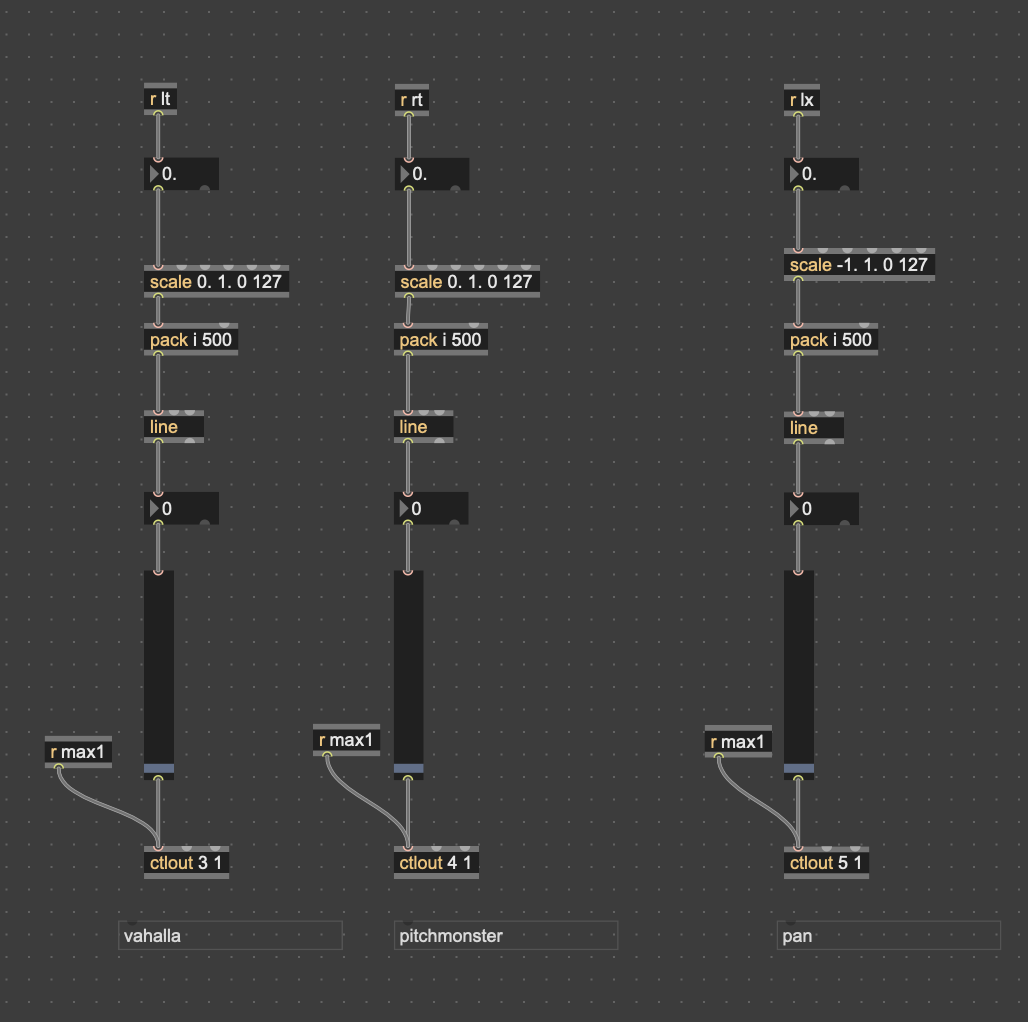
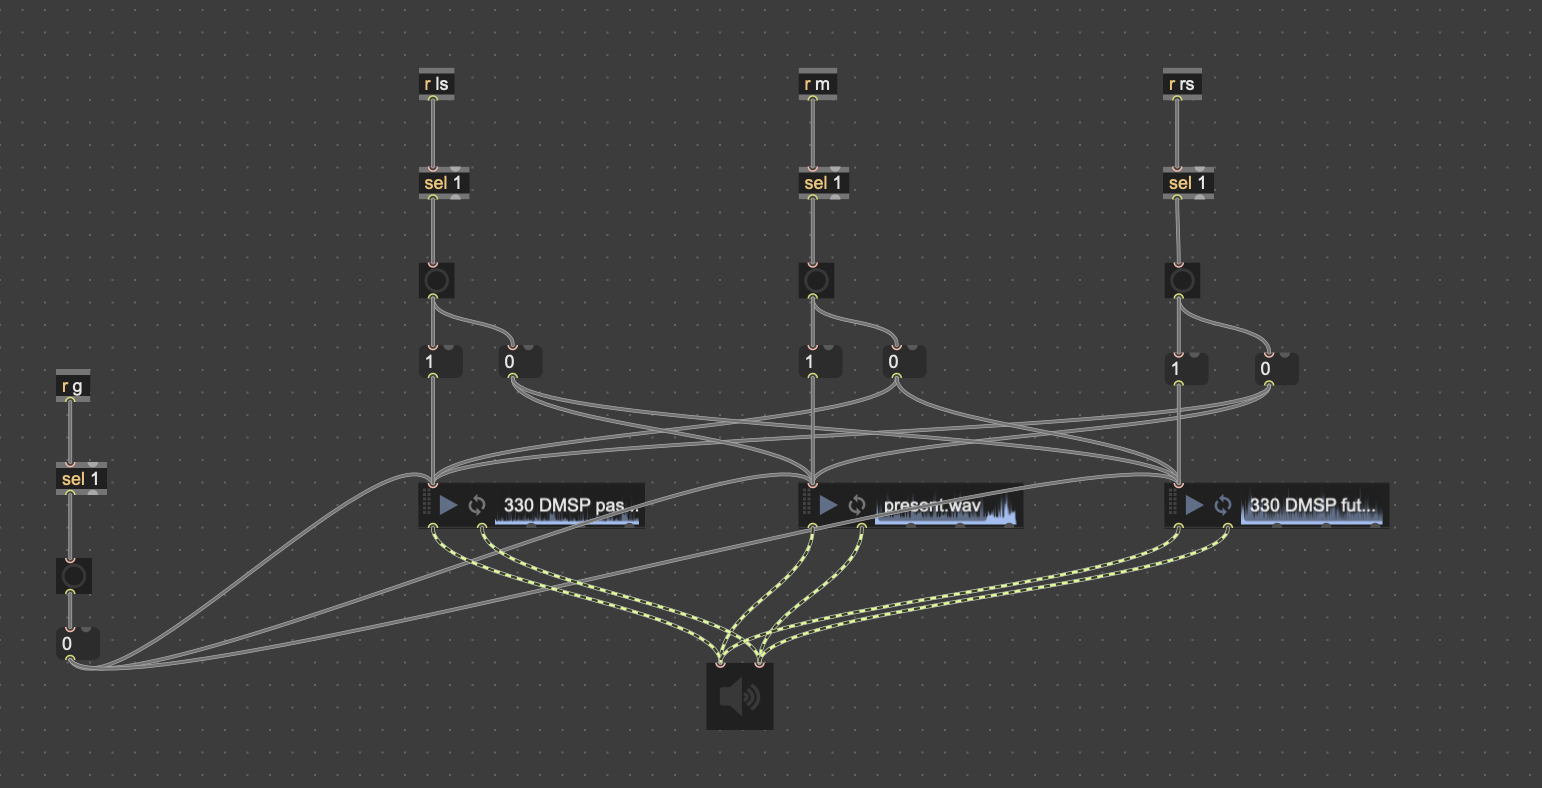
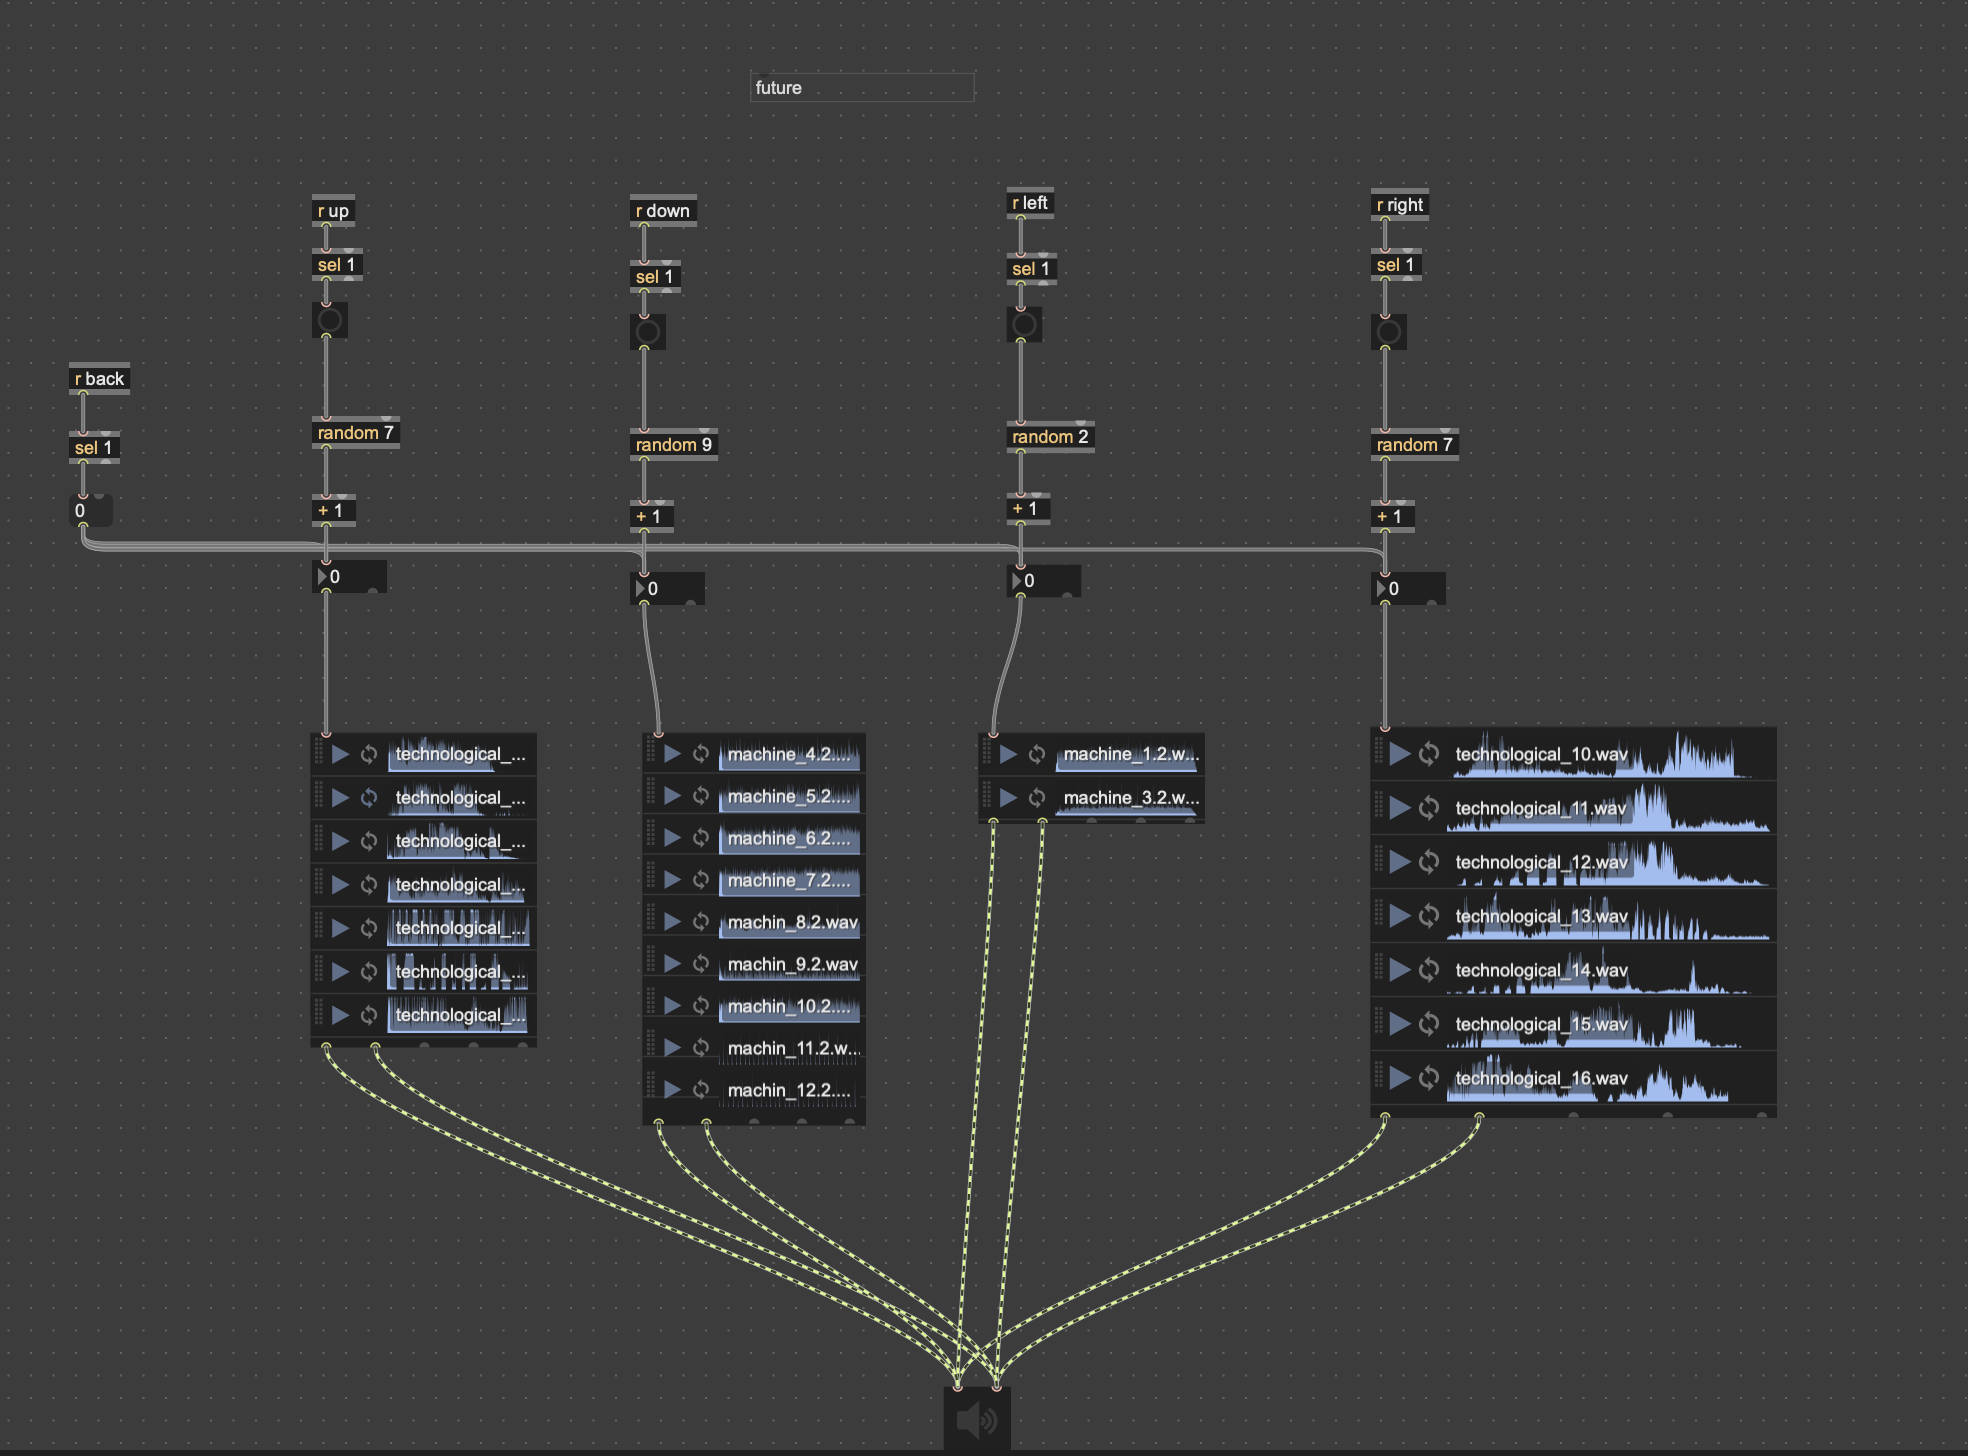
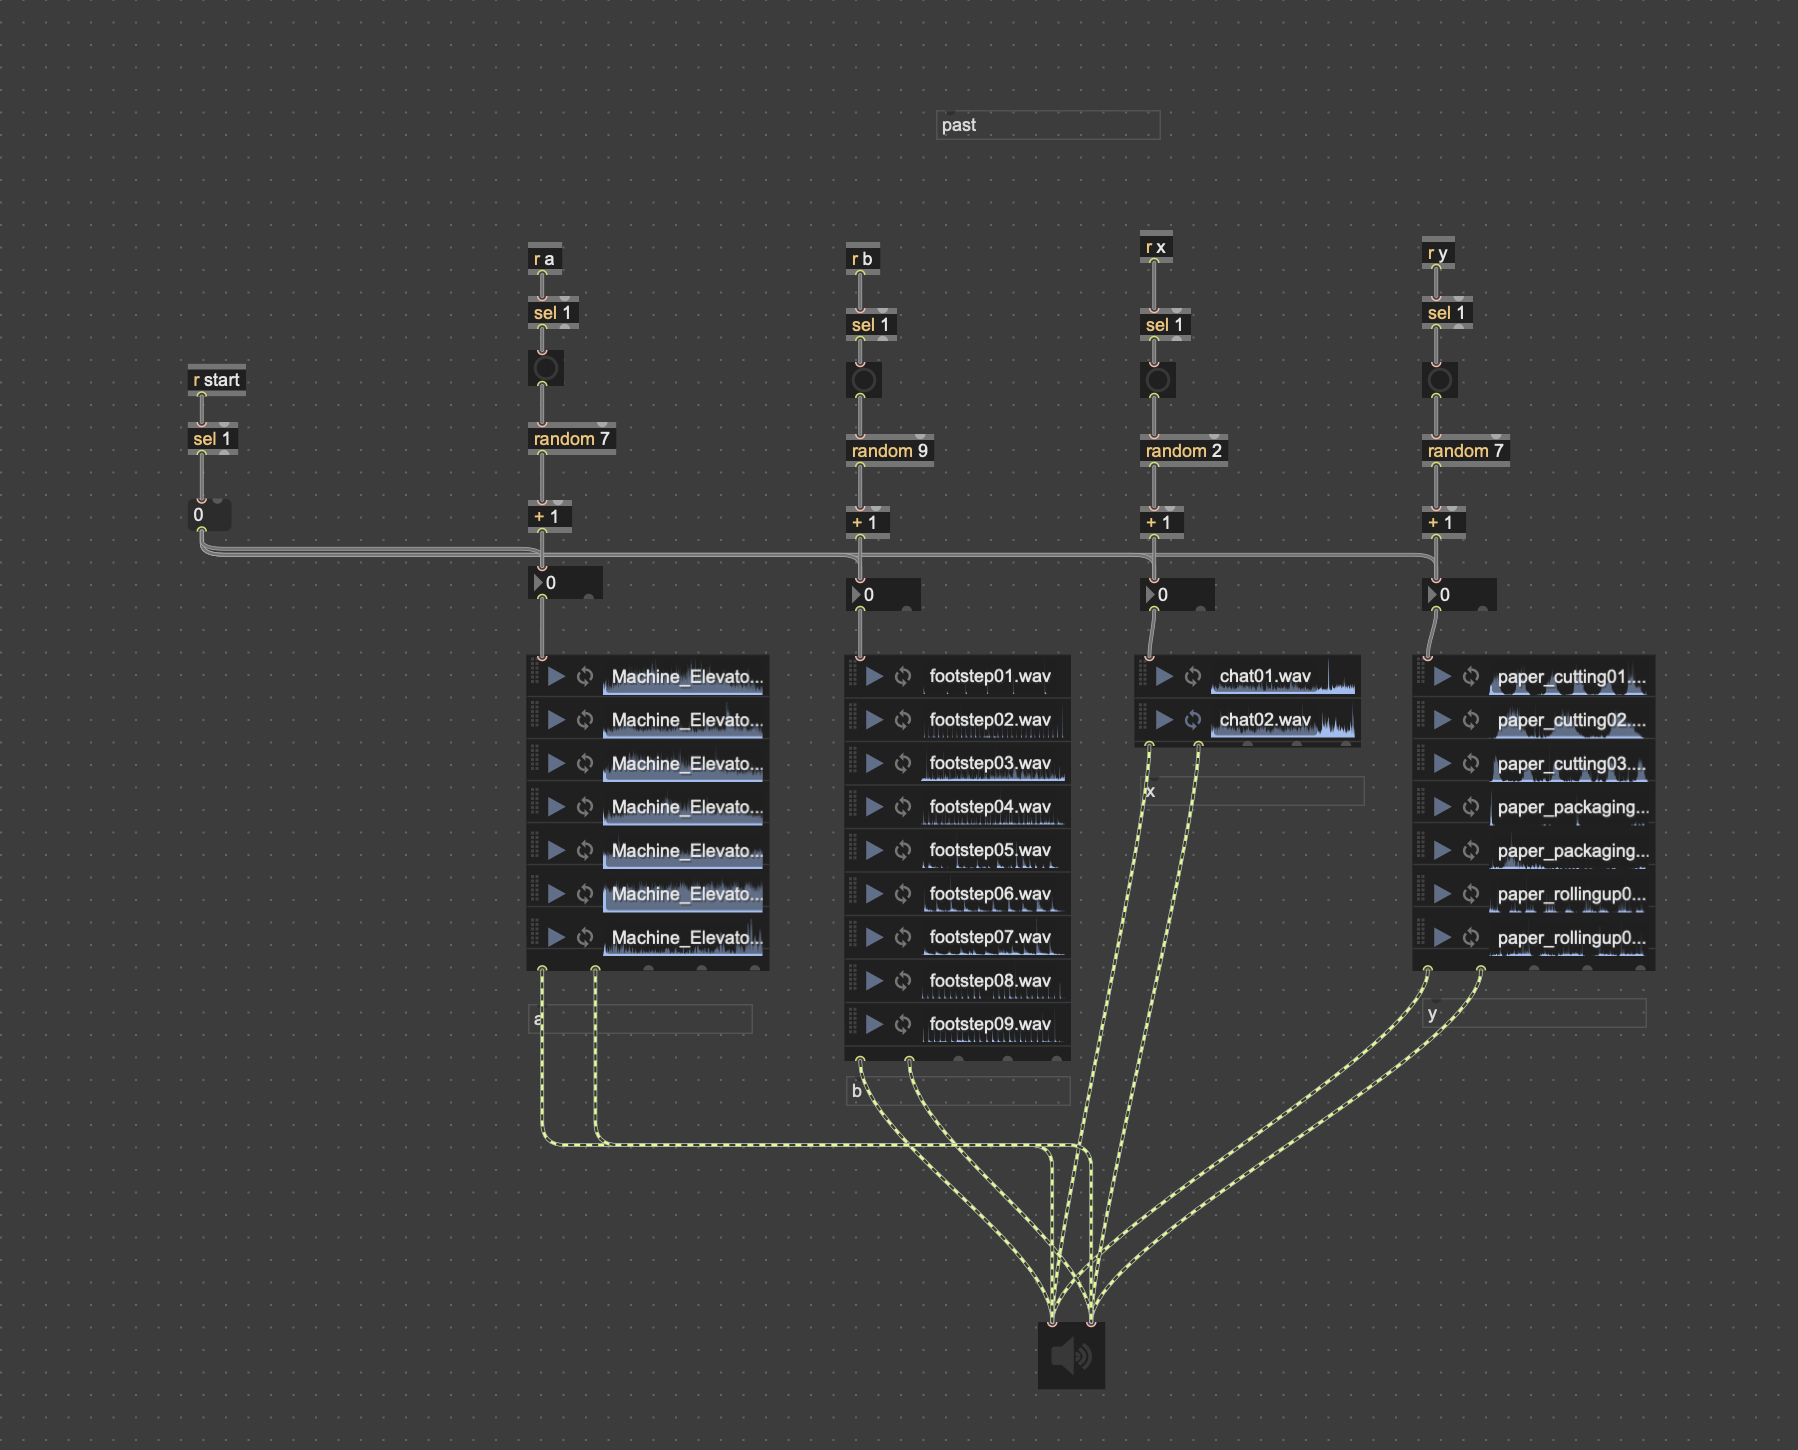
Although I did not build the audio system itself (which was handled by teammates in MAX/MSP), I created a responsive bridge between their output and my visuals.
Using audiodevin CHOP in TouchDesigner, I received real-time frequency and amplitude data from a shared channel.
I then mapped frequency bands (bass, mids, treble) to visual parameters:
-
Bass influenced brightness intensity
-
Mids controlled Z-axis jitter
-
Highs added subtle hue shifts
This allowed the point cloud to react to sound in atmospheric ways—flickering gently to ambient tones or pulsing rhythmically to sharper audio triggers
4. Final Installation & Collaboration
In the final group exhibition, my TouchDesigner system was fully integrated with Jiaming’s projection mapping and ambient lighting setup.
Together, we built an immersive installation that projected the reconstructed factory onto a dark-walled room using high-resolution projection.
The point cloud floated in mid-air, responding to sound through subtle shifts, flickers, and spatial modulation.
Visitors were invited to walk around or sit inside the space, listening to the soundscape while watching the virtual factory respond in real time.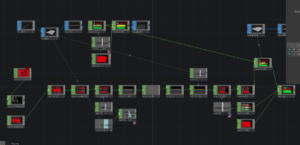
5. Reflection
This project offered me not only a technical learning experience but also a new way to reimagine industrial space through sensory transformation.
I began the journey thinking I would merely replicate a building’s geometry—but I ended up building a spatial interface that interacts with sound and presence.
Some key takeaways:
-
Scanning requires not only precision but creative planning—balancing coverage with speed
-
Visualisation is not about showing data, but communicating spatial feeling
-
Modular thinking in tools like TouchDesigner allows for flexibility across different outputs (installation, screen, or AR)
From Leica hardware to software pipelines, from raw data to immersive media, this process taught me how space can be sensed, shaped, and shared—not only as structure, but as experience.
Written by Ren Yuheng S2593996