Any views expressed within media held on this service are those of the contributors, should not be taken as approved or endorsed by the University, and do not necessarily reflect the views of the University in respect of any particular issue.

Field Work

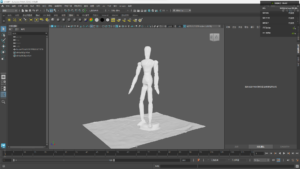
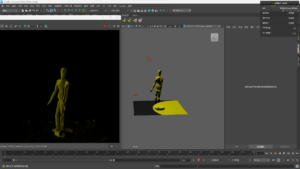
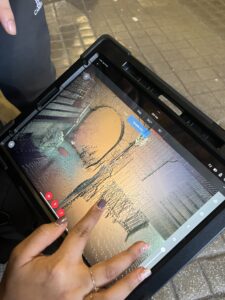
In terms of scene scanning we scanned a total of eight objects, of which four large scenes and two special objects we did special processing through other software in the post.

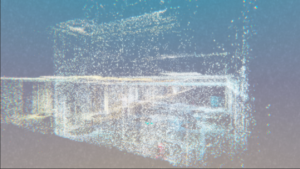
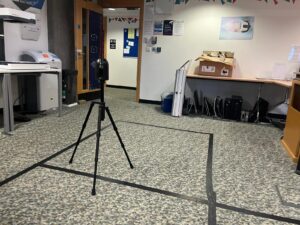
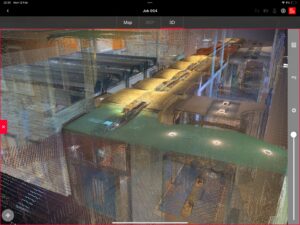
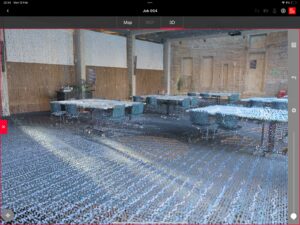
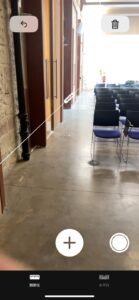
Firstly, we chose EFI as our test site for our first scan and we recorded the detailed scanning process in this scan. So we can be handy for future scans.The reason for choosing EFI is firstly because EFI has a wider environment while the house is sorted in a more regular manner, and it is more convenient to collect data with less foot traffic.In order to enhance the collection of data, a two-phase approach was implemented. Initially, a comprehensive scanning of classrooms was conducted, encompassing all corners to delineate the spatial extent of the building. Subsequently, a detailed examination of the interior of each room was carried out to capture nuanced features. The second phase concentrated on the internal corridors of the building, employing an inward-to-outward methodology to gather comprehensive spatial data. This approach encompassed the acquisition of positional, chromatic, and intensity data, enabling a meticulous assembly of point cloud data and the identification of optimal capture angles for detailed analysis.

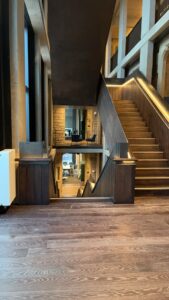
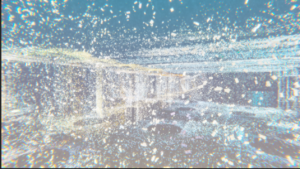
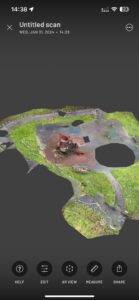
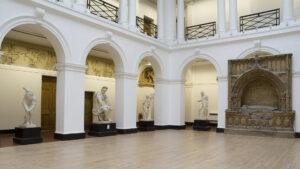
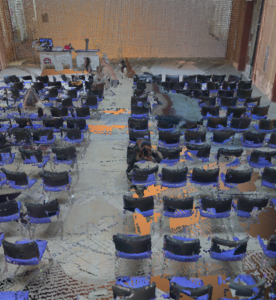
The initial selection for our primary scanning endeavor was the Edinburgh College of Art (ECA). Given our nascent acquaintance with radar scanning technology at this juncture, we opted for an environment with which we held a profound familiarity—the ECA Main Building. Specifically, our focus extended to the West Court and Sculpture Court within the aforementioned edifice, alongside the interlinking corridor facilitating access between these locales. Notably, these areas not only serve as focal points for numerous campus activities but also witness considerable pedestrian traffic, thereby affording a rich tapestry of diverse and compelling data. Moreover, given their recurrent role as venues for our academic pursuits and culminating events, we deemed it a singularly poignant endeavor to encapsulate these spaces as emblematic data points.

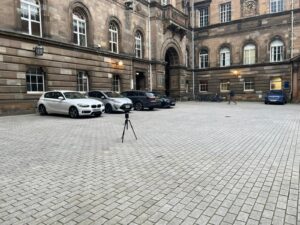
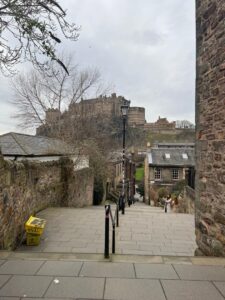
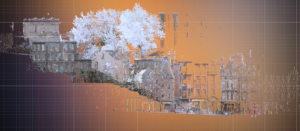
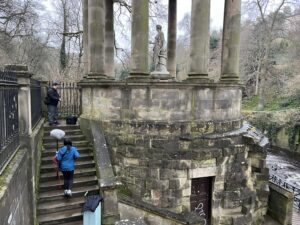
Subsequently, our exploration extended beyond the confines of the campus to encompass an off-campus locale—the Vennel Steps. This distinctive site not only serves as a pivotal conduit linking Lauriston Place and West Port but also affords a panoramic vantage point overlooking the majestic Edinburgh Castle. Reverberating with the collective memory of the city, the Vennel Steps transcend their utilitarian function to assume the role of a symbolic bridge, forging connections between disparate locales. From a data-centric perspective, this site boasts a singularly unique topography characterized by staggered elevations, punctuated by the surrounding residential structures. Such distinctive features lend themselves to an unparalleled portrayal through the lens of data points, offering a nuanced depiction distinct from that of other locations.

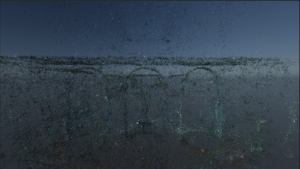
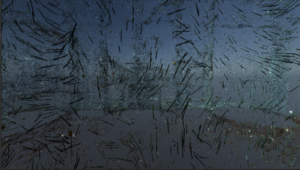
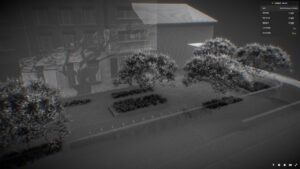
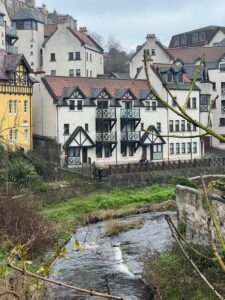
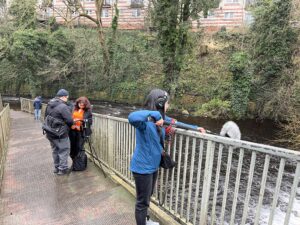
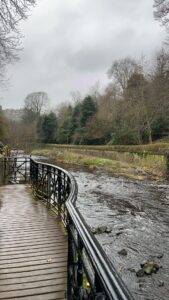
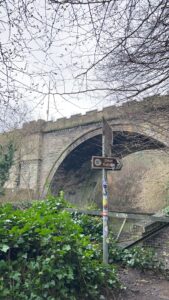
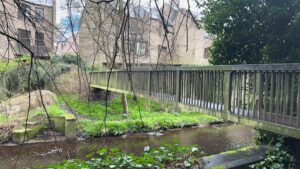
After that, our data collection efforts transitioned towards outdoor environments, with Dean Village—an esteemed historic locale nestled in the north-western precincts of Edinburgh—emerging as the focal area for our endeavors. Our initial foray led us to the environs of the Water of Leith Walkway, where we meticulously scanned a wooden bridge adorning the path. Nestled amidst a serene ambiance, this bridge epitomized solidity, connectivity, and enduring continuity in its steadfast form. Its tangible presence served as a tangible point of embarkation, imbuing our journey with a palpable sense of foundation and materiality. Subsequently, we directed our attention towards a nearby waterfall, strategically chosen for its dynamic character—a departure from the static features of previous scanning locales. This marked our inaugural attempt at capturing data from a substantial, dynamically evolving entity, thereby broadening the scope of our technical proficiency and experiential repertoire.

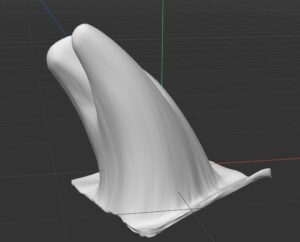
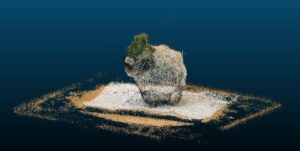
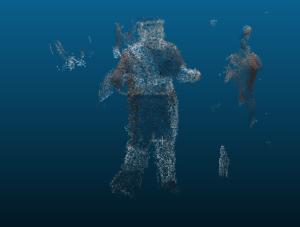
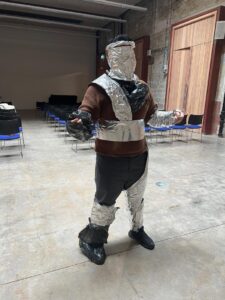
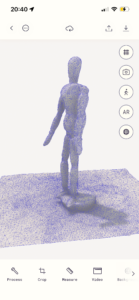
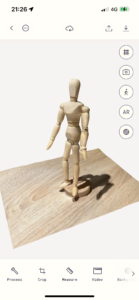
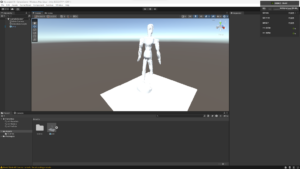
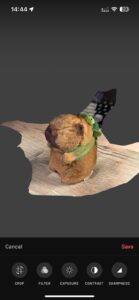
In addition to large scenes, we also scanned a number of other objects, such as people and some small objects.

Campus point cloud modelling in unity

We chose to use unity and Keijiro Takahashi’s point cloud model renderer plugin for the campus section. With the popularity of 3D scanning technology, point cloud data has become increasingly important in various fields such as industrial design, architecture, and mapping. However, point cloud itself as an unstructured data format has relatively low rendering efficiency when visualized directly. Unity is a popular 3D game engine that provides efficient rendering support for particle systems through its built-in VFX Graph tool.

The campus point cloud data in PLY format is imported into Unity project using the Point Cloud rendering plugin. The plugin automatically extracts vertex position and color information from the point cloud to generate Position Map and Color Map texture assets.

A ParticleSystem node is added as the base particle system in the VFX Graph window. A SetPositionFromMap node is used to read the position of each particle from the Position Map. A ColorOverLifetime node is used to read the color of each particle from the Color Map. The velocity property of particles is disabled to keep the point cloud static. A Turbulence node is added to introduce fine details and a Color node is used to control transparency.

The VFX Graph is attached to the scene to achieve real-time point cloud rendering. Optimization involves balancing sampling rate and details.

In general, the methodology is as follows:

  1. Point cloud import

Imported a PLY point cloud file of campus using the Point Cloud Render plugin in Unity.


  1. Generate vertex textures


The plugin automatically generated a Position texture storing vertex positions and a Color texture from the imported point cloud data.


  1. Create a VFX graph


A ParticleSystem node was created as the base in the VFX Graph window.


  1. Set particle positions


A SetPositionFromMap node was added to sample the position of each particle from the Position texture.


  1. Set particle colors


A ColorOverLifetime node was used to sample the color of each particle from the Color texture.


  1. Disable particle velocity


The Velocity property in the system was disabled to keep the point cloud static.


  1. Add details


A Turbulence node was used to adjust the shape and a Color node controlled particle transparency with ALPHA.


  1. Render the scene


The VFX graph was added to the scene to see the real-time rendered point cloud effect.


  1. Optimization tips


Sampling rate could be optimized to balance detail and performance, and emitter size adjustment was suggested.

Digital Hyperobject-unity part

We chose two colleges, EFI and ECA, for the architectural aspects of the scanned data, the specifications of the interior scans of the two buildings were well suited for digital processing, and I chose different themes for the processing of the data for the two colleges, based on my own understanding of each of the colleges.

The first phase involved processing the point cloud model of the Edinburgh Futures Institute (EFI) building. Nestled within the historic Old Royal Infirmary and serving as a vital component of the University of Edinburgh, EFI embodies a fusion of innovation and forward-looking scholarship. When conceptualizing the design ethos for this pioneering institution, paramount importance was given to its futuristic outlook, encapsulated by the overarching theme of “fantasy and technology”. Thus, the aesthetic chosen for representing EFI’s particles exudes a distinct technological vibe, characterized by vibrant blues and yellows. Every data point takes on the appearance of a fluctuating piece of paper, symbolizing the transient nature of information dissemination and evolution. The color palette extends beyond blues and yellows to encompass an eclectic range including azure, emerald, amethyst, and citrine. Furthermore, the dynamic positioning of each data point infuses the ensemble with an ethereal, ever-shifting quality, evoking a surreal, dreamlike atmosphere.

Next is the ECA Academy, The design methodology employed in shaping the point cloud data for the campus section centered on reimagining familiar landscapes. At its core was the vision for the Edinburgh College of Art (ECA), characterized by the theme of “natural growth”. This approach involved integrating various elements, such as the West Court of the ECA’s main building, the architectural layout of the Sculpture Court, and the spaciousness of the ECA center courtyard. Through harnessing the transformative potential of the point cloud model, each data point was infused with qualities reminiscent of lush greenery, evoking the organic evolution of plants. With careful processing, the point cloud model depicted a dynamic visual representation, mirroring the continuous growth of botanical life. As a result, the ECA’s architecture took on the appearance of a structure reclaimed by nature, surrounded by thriving vegetation.


Radar scanning model rendering test (Draft)

Firstly, the original model obtained from the scanning


The following section shows the effect of offline rendering:

Next is the dynamic rendering

Since the test was not done with professional equipment, the detail of the model was definitely not good enough, but both the test and the previous model after scanning with professional equipment were too messy for post-processing the normals at a low cost due to the overly messy uv’s.

Note: Subsequently I tried to import the noise model’s forced direct conversion to fbx or obj format from sketchfab to achieve the perspective effect, but this didn’t work.


Data Visual Design

Firstly, conceptually, LIDAR is a laser technology that can capture objects and three-dimensional surfaces in space. After scanning, a data model can be obtained, however, the original scanning model generally has a high number of faces and its uv is not considered continuous, the scanning model I got is using each face is a separate uv block, this uv block corresponds to a piece of colour on the texture map, maybe this is more convenient for the automatic generation of uv and texture maps when scanning, and the automatic generation process may produce a lot of fragmented and scattered Each texture corresponds to a material ball. It is possible to generate a low model of the scanned model by surface reduction software, but if you don’t merge and re-process the uv and texture of the generated low model, it will lead to too many material spheres and textures, and there are too many uv seams and overlapping vertices, which makes it difficult to do normal baking.So we probably won’t be doing too much with the materials of the model, and will probably continue to use a point model rather than a face model at this stage.And the treatment of the point model can be summarised in three steps:

a. Importing point cloud data:
Firstly, you need to import the point cloud data scanned by the LiDAR into the computer software of your choice. Many 3D modelling software support importing point cloud data, such as MeshLab, CloudCompare, etc.

b. Cleaning and filtering:
Lidar scanned point cloud data may contain noisy or irrelevant points that need to be cleaned and filtered. This can be done by removing outlier points, performing smoothing operations, or applying other filters.

c. Point Cloud Reconstruction:
After cleaning and filtering, you can use point cloud reconstruction algorithms to convert the point cloud data into a surface mesh, which means that the points in the point cloud are connected to form a surface. This can be done with algorithms such as Poisson Reconstruction, Marching Cubes.

And all the above steps can be simply realised in the software accompanying the radar system. And after the above steps are completed we need to import the model into Maya or Blender to set up the track animation. The tentative initial approach now is to set up a first person view camera as the subject.The first thing to do is to create the path curve, which will animate the object that will move along the track, this can be done using the “EP Curve Tool” in the “Create” menu to draw the curve freely. Then it’s time to set up the path animation: select the camera and choose “Animate” -> “Motion Paths” -> “Attach to Motion Path” in the menu bar. In the options window that pops up, select the path curve and adjust settings such as Offset, Start Frame, End Frame, etc. Then it’s time to adjust the animation parameters and add additional animation effects, which will be changed a little further when you get down to the nitty-gritty.

Proceedings

This section serves as a brief summary of several meetings held up to the time of Submission 1, and is used as an outline; details of each meeting can be found in other sections of the Blog.

January 25th, 2024

Theme of the Conference :Group members met after class to learn about our professional backgrounds, software us specialise in, and to set up a Miro, whatsapp group for future communication.Additionally, we confirmed with Asad email that the meeting will take place every Friday.

January 26th, 2024

Theme of the Conference :The first formal meeting to learn from Asad about the relationship between data and Place and how we should go about applying that data, in addition to watching some videos made from the data we got from the radar scans, which helped us to get a better understanding of the topic of the class, and after the class we each came up with our own ideas for the project we were going to work on.

February 1st, 2024

Theme of the Conference:We didn’t get to borrow radar equipment as our school wasn’t able to train us this week, but we still did some scanning via our mobile phone apps.

In addition, we have come up with some ideas for this assignment, the exact details of which can be found in the Blog.

February 2nd, 2024

Theme of the Conference:For this meeting we consulted Asad and we planned and summarised our previous ideas in detail, in addition we considered the feasibility of the individual plans.

As none of us are familiar with the effects of radar scanning, at Asad’s suggestion we will start by picking a few locations around the school to scan and see how it works. After having a detailed understanding of the radar we will proceed to the next step.

February 5th, 2024

Theme of the Conference:We spent the day training on the radar instrument, learning the basic operating principles and use of the radar, and were given a week’s worth of radar to use.

In addition, we chose a suitable location within the campus to conduct a field survey after the training was completed.

February 8th, 2024

Theme of the Conference: In this meeting, we have consolidated the results of the previous meetings in order to come up with a general draft of the programme, and we have decided to bring different experiences to the audience by projecting the data from the radar scans onto different materials.In addition, we have selected a video for reference.

February 9th, 2024

Theme of the Conference:

Based on yesterday’s meeting, we held this online meeting mainly to determine everyone’s responsibilities in the project, with Akshara in charge of the data collection statistics and model presentation part, YiFei in charge of the visual effects and project documentation part, and MingDu and QingLin managing the sound design as well as the conversion processing between the data and the sound effects.

February 12th, 2024

Theme of the Conference:Asked Asad for advice based on all the tasks we have completed at this stage, as well as asking some questions about some of the problems we had in completing Submission1. Also learnt how to import the data we collected using the radar into the software to turn it into a model, do some simple texturing of the model, animation and export the model to other formats.

css.php

Report this page

To report inappropriate content on this page, please use the form below. Upon receiving your report, we will be in touch as per the Take Down Policy of the service.

Please note that personal data collected through this form is used and stored for the purposes of processing this report and communication with you.

If you are unable to report a concern about content via this form please contact the Service Owner.

Please enter an email address you wish to be contacted on. Please describe the unacceptable content in sufficient detail to allow us to locate it, and why you consider it to be unacceptable.
By submitting this report, you accept that it is accurate and that fraudulent or nuisance complaints may result in action by the University.

  Cancel