Any views expressed within media held on this service are those of the contributors, should not be taken as approved or endorsed by the University, and do not necessarily reflect the views of the University in respect of any particular issue.

Sound Object – diegetic field recordings and nondiegetic data sonification

The combination of visuals and sound in films brings us an immersive experience, where sound plays a crucial role in shaping immersive spaces.Michel Chion categorizes film sound into two parts in “Audio-Vision: Sound on Screen”: Diegetic, which is sound within the narrative space, and Nondiegetic, which is sound outside the narrative space. The interplay and transformation between these two types of sound create a sensory immersion for the audience.Meanwhile, Ben Winters mentions in “The Non-diegetic Fallacy: Film, Music, and Narrative Space” that Nondiegetic sound is partly a sign of the fictional state of the world created on screen.Therefore, can we apply the theories of Michel Chion and Ben Winters to art installations, making sound an indispensable part of sensory immersion and allowing sound to work with visuals to create a field within the “Place” of this installation?

Sound is divided into two parts: Diegetic and Nondiegetic. Diegetic refers to field recordings, while nondiegetic refers to LiDAR data sonification. In the Diegetic component, we use field recordings to reveal the unnoticed details in the real world, which can give the audience a sense of familiar unfamiliarity. This type of sound can shorten the distance between the audience and the space of the installation. In the Nondiegetic aspect, we primarily use sounds from synthesizers, which are very distinctive and can quickly capture the audience’s attention. Through the combination of diegetic and nondiegetic sounds, the entire installation’s field is placed at the intersection of reality and virtuality, making it both real and beyond reality.


The sound design of this project is strategically divided into two principal components: diegetic field recordings and nondiegetic data sonification.

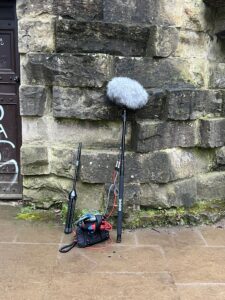
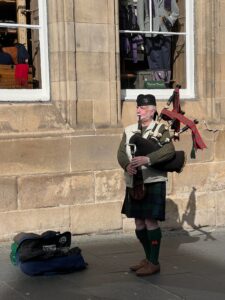
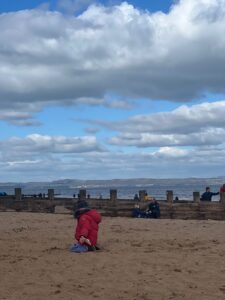
Diegetic Component: This segment includes field recordings from iconic locations across Edinburgh, including historic Royal Mile, bustling Princes Street, tranquil Dean Village, busy Waverley Station, and relaxing Portobello Beach. Crafted from meticulous field recordings, this object captures the essence of Edinburgh’s diverse auditory environments, weaving together the distant chatter of passersby with the rapid flowing of water into a rich tapestry that embodies the city’s unique atmosphere. This approach allows exhibition visitors to immerse themselves in the complex soundscapes of Edinburgh, experiencing it as a cohesive hyperobject within a singular exhibition space.

Nondiegetic Component: This component focuses on the sonification of LiDAR scan data, employing Max/MSP to transform the point cloud into the audible. Specifically, this data-driven sound design translates the intricate spatial (XYZ) and color (RGB) data of Edinburgh’s Vennel Step and Dean Bridge into a captivating auditory experience. The essence of these places is not merely represented but reimagined through the sonification, creating a soundscape where technology meets artistry.


1. DIEGETIC FIELD RECORDING

The field recordings are edited into several one-minute segments, seamlessly interconnected by ambient music transitions, offering a continuous 12-minute auditory journey. Each segment is introduced by a voiceover, delivered in a Scottish accent, that introduces the featured location, thereby grounding each auditory snapshot in its geographical and cultural context.

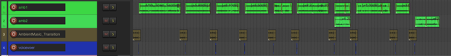
Figure 1: The edit session of the 12-minute field recording

The ambient music transitions serve not only to give the audience a moment to refresh their ears and prepare for the next soundscape, but also to reflect the high-dimensional nature of Hyperobjects. These transitions use pads to establish a sonic zone conducive to mind wandering, complemented by the use of reversed bell sounds to symbolize the free flow of time. This musical approach not only enriches the listening experience but also simulates the sensation of navigating through time and space within a multi-dimensional framework.

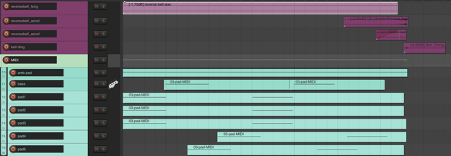
Figure 2: The arrangement session of ambient music transitions

This auditory experience transforms everyday noises into a profound exploration of space and memory, guiding you through an unseen Edinburgh where every sound tells a story. It extends an invitation to experience Edinburgh as never before, where the essence of each location is not only heard but deeply felt, creating a vivid and lasting impression of the city’s atmospheric diversity.


2. NONDIEGETIC DATA SONIFICATION

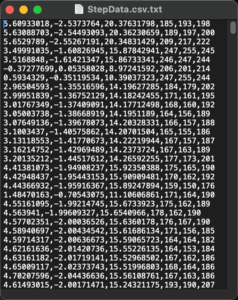
LiDAR technology, which captures environments to generate point cloud data, provides a distinctive avenue for uncovering the hidden characteristics of a place through sound. The point cloud data obtained from LiDAR scans can be converted into a CSV format readable by Max/MSP using CloudCompare, facilitating the manipulation of audio based on data.

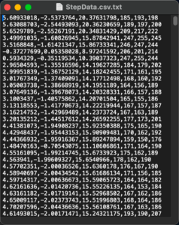
Figure 3: The raw point cloud data of Vennel Step

Within the Max patch framework, RGB data-driven sounds emerge as primary sonic elements. A general control mechanism assesses the RGB values to identify the dominant color, which then activates the playback of a color-correspondent sound. This sound mapping process is influenced by subjective color associations: red with sharp, intense sounds; green with natural sounds; and blue with harmonious sounds. This method not only audibly illustrates the visual spectrum but also invites listeners to explore the emotional resonance of colors.

Depth is articulated through the Z data, introducing a layer of complexity to the soundscape. By mapping the vertical extremities of each site to distinct sounds, the installation captures the topographical variance of Edinburgh. This approach not only highlights the physical contours of the locations but also envelops the listener in a multi-dimensional auditory space.

Furthermore, significant shifts detected between adjacent rows of LiDAR data—marking the completion of an angular scan—are signified through a distinctive “hit” sound, thereby audibly marking the progress of the scanning process. Other data types, not directly converted into sound, serve as control signals that adjust sound parameters such as cut-off frequency and volume in real-time, adding a dynamic layer to the auditory experience.

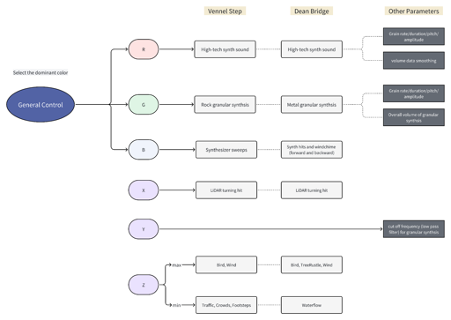
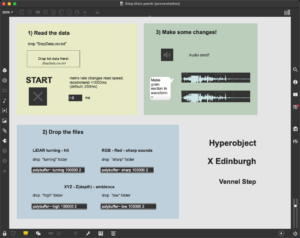
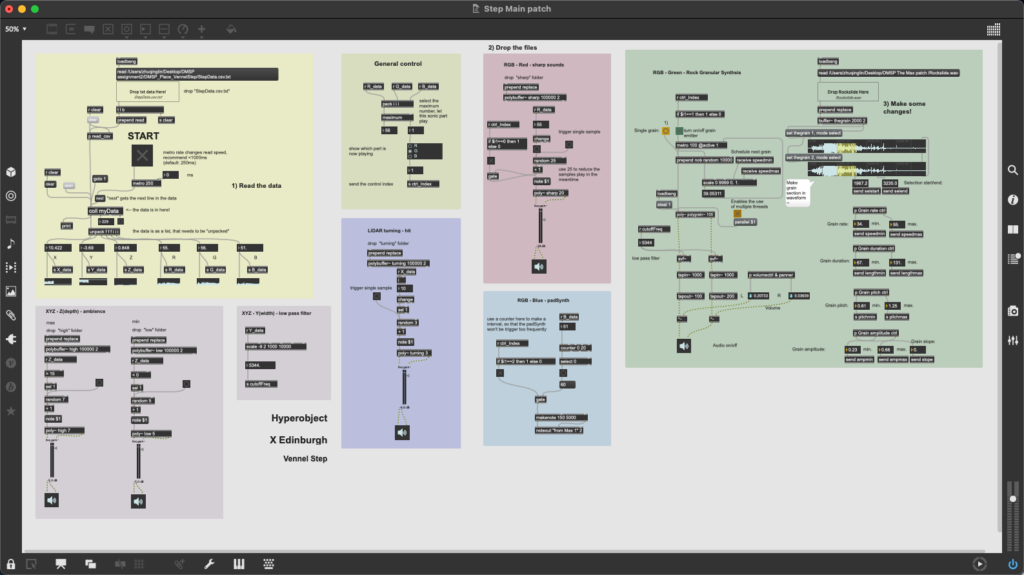
Figure 4: The diagram of the Max patch

While the Max patches for both locations share a basic logic, modifications have been made in audio sample selection and data mapping to reflect the unique characteristics of each site.


Red: Shared Elements Across Sites

Both locations employ the same audio assets for the color red, which represents the high-tech texture of LiDAR. This uniformity emphasizes the technological underpinnings central to both sites, thereby reinforcing their conceptual linkage.


Green: Site-Specific Sound Design

For the color green, we have implemented granular synthesis to reflect the granularity of point cloud data typical of LiDAR scans. By dynamically adjusting parameters such as grain rate, duration, pitch, and amplitude, we transform the data’s variance into an auditory experience. Specifically, the base materials differ: Vennel Step incorporates sounds derived from rock, while Dean Bridge uses metal sounds, reflecting their respective construction materials.


Blue: Interpreting the Color and the Site Feature

At Vennel Step, the color blue is conveyed through MIDI outputs that trigger harmonious synthesizer sweeps. These sweeps metaphorically depict the significant elevation changes of the steps, likening the vertical variation to the changing rate of an LFO (Low Frequency Oscillator) in a synthesizer. This auditory translation invites listeners to experience the physicality of the steps through sound.

At Dean Bridge, blue is represented by playing a specific audio sample, composed of harmonious synth hits and wind chime sounds, both forwards and backwards. This technique symbolically reverses time, reflecting the bridge’s longstanding presence and its role as a temporal conduit linking the past, present, and future. Through these sounds, we encourage the audience to perceive the bridge across various temporal dimensions.


Z Depth: Reflect the surroundings of the site

Vennel Step’s low end is adjacent to a bustling road. When Z is at its lowest range, the sounds of traffic, conversing crowds, and pedestrian footsteps dominate, capturing the urban vibrancy of the area. As Z ascends to its highest range, the ambience shifts dramatically—birds chirping and wind rustling become discernible, previously masked by the city noise and becoming perceptible only at elevated heights.

At Dean Bridge, the extremely low range of Z captures the sound of water flowing under the bridge. At the highest range, the auditory scene shifts to include birds, wind, and the rustling of trees. This reflects the natural environment surrounding the bridge, embraced by venerable trees.

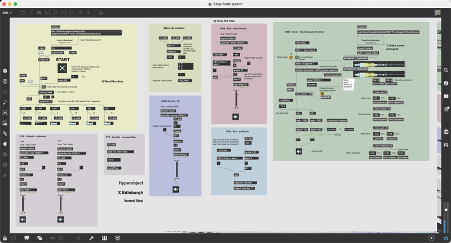
Figure 5: The Max patch of Vennel Step

This data sonification offers more than just a novel way to perceive data; it invites participants to immerse themselves in the digital heartbeat of Edinburgh, where every data point sings a piece of the city’s story, crafting an immersive narrative that bridges the gap between the digital and the sensory.


The overall sound design for this project represents a pioneering endeavor to merge the realms of environmental sounds and data sonification into an immersive auditory experience. By capturing the essence of Edinburgh through field recordings and interpreting physical data through sonification, we offer a unique dual narrative of the city. This innovative approach not only showcases the potential of sound as a medium to interpret and represent LiDAR data, but also invites audiences to engage with the environment and data in a deeply immersive and sensory manner.

Field Recording

We conducted field recordings at several iconic locations throughout Edinburgh, including the Royal Mile, Princes Street, Dean Village, Waverley Station, and Portobello Beach, each chosen for its unique soundscape.


(Amb_DeanVillage_waterflow_rapid_close)

In Dean Village, the uneven terrain necessitated a flexible recording setup, so we used two Schoeps MK4 microphones mounted on a boom pole. These microphones come equipped with Stereo Windshields preset to the XY recording configuration, so we changed our recording plan from ORTF to XY configuration instead. During the sound walk, we identified the sound of flowing water as the distinctive soundmark of Dean Village. We then strategically captured this sound from various distances—distant, medium, and close-up shots—to record the water’s diverse sonic expressions.


(Amb_RoyalMile_ScottishBagpipes_withApplause)

At other locations, the presence of large crowds made it impractical to use such conspicuous equipment. As a result, we switched from Mixpre6 to the more handy Zoom H4n recorder, which features an integrated XY stereo microphone. Although this handheld recorder’s built-in microphone has limited optimal working distance and does not match the sound quality of the MK4 pair, it allowed us to capture the essence of each place without disrupting natural behaviors. For instance, on the Royal Mile, we captured the iconic sounds of Scottish bagpipes and crowd applause; on Princes Street, the ding-ding of trams and the hum of busy traffic; and at Portobello Beach, not only the waves but also the sounds of beach volleyball and lively chatter from seaside restaurants.

This strategic adaptation to each location’s specific acoustic environment allowed us to capture the most authentic and vibrant sounds possible. These recordings not only document the sonic diversity of Edinburgh but also enhance our project’s ability to transport listeners into the heart of each iconic place through sound.

Hyperobject X EDINBURGH – Sound Design Preview

Overview

The sound design of this project is strategically divided into two principal components: diegetic field recordings and nondiegetic data sonification.
Diegetic Component: This segment includes field recordings from iconic locations across Edinburgh, such as Royal Mile, Princes Street, and Dean Village. These recordings act as auditory snapshots, capturing the distinct soundscapes of each area. By weaving together these snapshots, we construct a rich soundscape that encapsulates Edinburgh’s diverse auditory essence. This approach allows exhibition visitors to immerse themselves in the complex soundscapes of Edinburgh, experiencing it as a cohesive hyperobject within a singular exhibition space.
Nondiegetic Component: This aspect focuses on the sonification of LiDAR scan data, employing Max/MSP to forge a connection between data points and auditory experiences. Specifically, we sonify spatial (XYZ) and color (RGB) data from two selected places: Vennel Step and Dean Bridge. While the Max patches for both locations share a basic logic, modifications have been made in audio sample selection and data mapping to reflect the unique characteristics of each site.

Venue Setup

The exhibition’s audio setup will utilize the West Court’s built-in stereo speakers, complemented by four additional speakers. The built-in speakers will play the field recordings, whereas the four supplementary speakers, organized into two stereo pairs, will individually play the data sonifications for Vennel Step and Dean Bridge.

Sound Design Preview

2.1 Diegetic Field Recording

The field recordings from various locations will be edited into several one-minute segments, interconnected by ambient music transitions. Each segment will be introduced by a voiceover, delivered in a Scottish accent, naming the featured location. These sequences will create a continuous 15-minute auditory journey.

2.2 Nondiegetic Data Sonification

Within the Max patch framework, RGB data-driven sounds emerge as primary sonic elements. A general control mechanism assesses the RGB values to identify the dominant color, which then activates the playback of a color-correspondent sound. This sound mapping process is influenced by subjective color associations: red with sharp, intense sounds; green with natural sounds; and blue with harmonious synthesizer sweeps.
In addition to color, the Z data, representing the depth of a location, serves as a complementary element in the sonification. Sounds are strategically mapped to the extreme values of Z data, offering a varied sonic experience that mirrors the diverse altitudes encountered within the scanning locations. Furthermore, significant shifts detected between adjacent rows of LiDAR data—marking the completion of an angular scan—are signified through a distinctive “hit” sound, thereby audibly marking the progress of the scanning process. Other data types, not directly converted into sound, serve as control signals that adjust sound parameters such as cut-off frequency and volume in real-time, adding a dynamic layer to the auditory experience.

Conclusion

This project represents a pioneering endeavor to merge the realms of environmental sounds and data sonification into an immersive auditory experience. By capturing the essence of Edinburgh through field recordings and interpreting physical data through sonification, we offer a unique dual narrative of the city. This innovative approach not only showcases the potential of sound as a medium to interpret and represent LiDAR data, but also invites audiences to engage with the environment and data in a deeply immersive and sensory manner.

Feb.16 – Online Meeting with Asad

1. Concept

After reviewing our submission 1, Asad suggested using the concept of Hyperobjects to interconnect everyone’s ideas. He recommended we read “Hyperobjects: Philosophy and Ecology after the End of the World”.

https://www.upress.umn.edu/book-division/books/hyperobjects

Hyperobjects are massive, complex objects, such as climate, pollution, and cities. Typically, we can only indirectly perceive aspects of Hyperobjects and not see the whole picture. However, we can render these massive hyperobjects into sound and visuals, making this project into a data-informed synthesis of Hyperobjects.

2. Case Study

Recording Artist: Ben Frost
He used non-human phenomena to illustrate the scale and the stakes of the Amazon’s demolition.
Field Researcher: Richard Mosse
Bjork communicated with Timothy Morton about hyperobjects through letters.
Herman Kolgen worked with Seismic Data, explaining the earth as if the whole earth is an instrument.

3. Discussion

Asad began with an example of how precision LiDAR scans of the Notre Dame Cathedral, which had been destroyed, recorded its original appearance. This makes it so that nothing about this place truly vanishes; the electronic data from the LiDAR scans serve as an afterlife of this place.
Perhaps, our project isn’t just for us. The audience may not even be born yet. This work could be for Posthumans, Inhumans, Algorithms, Artificial Intelligences, and future unborn intelligences. We can use LiDAR-scanned point clouds to bring a place into the future.
Akshara asked how LiDAR-scanned locations could represent the hyperobject of climate change. Asad showed us the world’s oldest archive, a cave that existed before humans. This project uses Python for data analysis to analyze future ice melting trends, visualizing the appearance of ice caves after melting. Nature seems to become the architect, designing the space’s shape.
Asad also mentioned that we could consider point clouds as combinations of atoms, allowing us to modify the atoms in any way, such as changing the atom of a building into human hands. In the example below, Asad used dust as atoms to design the work.
Lastly, Asad discussed the interactive part, recommending the work “CORPUS NIL”. This innovative work utilizes Reinforcement Learning to enable machines to determine the most effective sound for the specific muscle moving. It involves outfitting a performer with numerous sensors across their body. These sensors capture the performer’s movements, and the system’s algorithm then processes this data to select and generate the sound that most accurately represents these movements. Following this, the performer reacts to the sound produced, creating a new sound as feedback. This interactive loop of action, sound generation, and response creates a dynamic performance that blurs the lines between human and machine collaboration.

Qinglin – Draft Ideas

In last week’s seminar with Asad, we discussed some preliminary ideas. After a comprehensive discussion, our main direction is to create an impactful audio-visual interactive installation.

(Pic 1: Our ideas recorded by Asad during the seminar)

I am particularly interested in Ming Du’s idea that “time is distance.” After class, I continued to discuss this idea with him. He wants to use four projectors to construct a “place,” arranged in the front, back, left, and right directions. The vertical axis represents space, which is distance, and the horizontal axis represents the flow of time.

I think sound has great potential in expressing time. Starting from the most direct aspects, we can think of the sounds of clocks and watches from various eras and styles. Extending further, we can also think of the sound of flowing water, as it is always moving in a directional manner, just like time. If we expand our thoughts further, perhaps we can associate it with the auditory memories of time in different regions, cultures, and eras.

What I’ve mainly discussed above is the aspect of timbre, but time also has a very significant characteristic: rhythm. At the most basic level, we can change the sound performance on a one-second basis, like constructing an alternative clock. If this stable rhythm is disrupted, it will lead to a shift from an objective to a subjective perspective. People’s current experiences cause their perception of time to change. Such a transformation is highly emotional and can produce some dramatic sound effects.

Regarding the artistic representation of time, I also want to recommend an independent game I recently played, which lasts about 10 minutes. It allowed me to attentively feel the flow of time.

The Shape of Time: https://yezi.itch.io/time

There was a minor setback this week. The staff responsible for LiDAR training is temporarily unavailable, so we couldn’t borrow the LiDAR equipment. Fortunately, they arranged a training session for us next Monday, and we’re very thankful to the uCreate staff!

After learning about this situation, Asad recommended that we first use Scaniverse on an iPad/iPhone to create miniature point cloud models of target locations. Scanning an entire space with a phone is somewhat challenging, so I tried scanning my York Ghost.

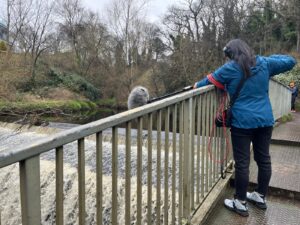
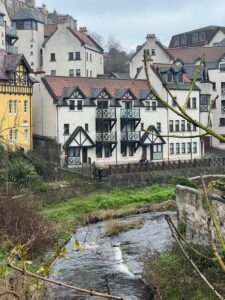
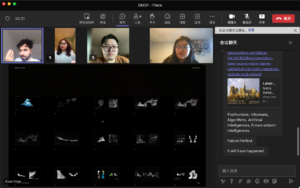
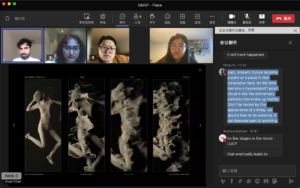
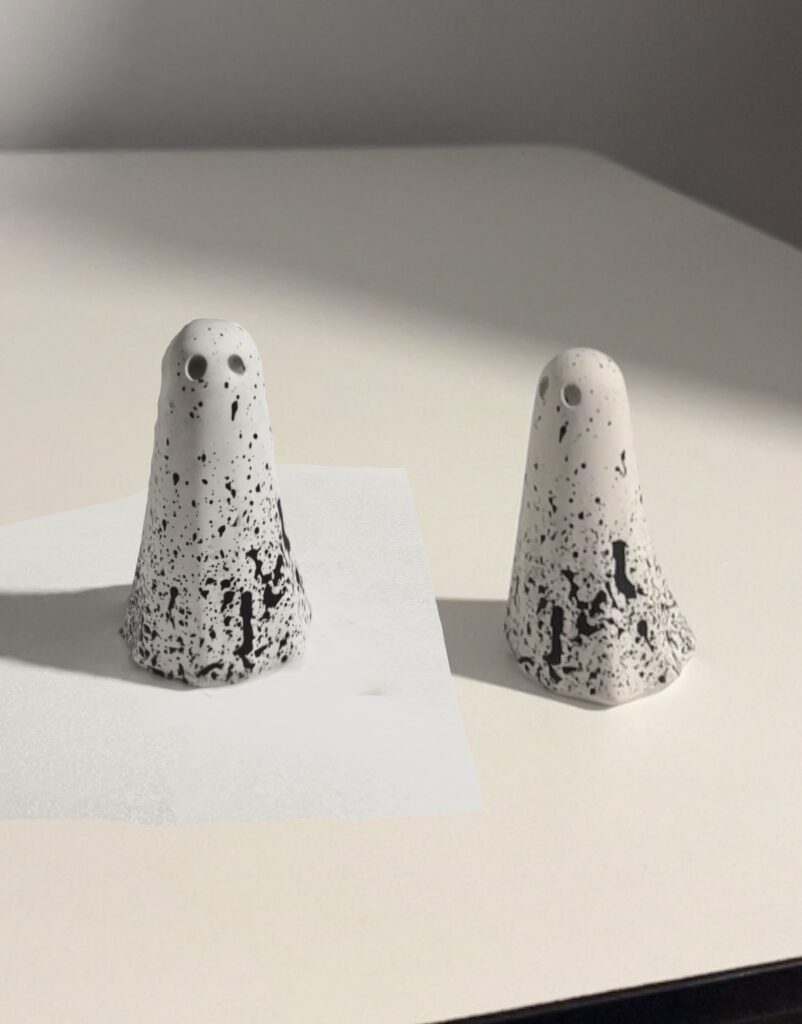
(Pic 2: Using AR functionality to take a photo of the scanned model alongside the original)

It feels quite novel to see objects around me recreated in 3D form on my phone. I am even more excited about what interesting spaces we will be able to record once we get the LiDAR equipment!

Asad also shared with us how to import Scaniverse data into Touchdesigner. However, the video only introduced the steps without explaining the principles, which is somewhat challenging for someone like me who has never used Touchdesigner before. Perhaps I should start by understanding some of the basic functions of Touchdesigner.

css.php

Report this page

To report inappropriate content on this page, please use the form below. Upon receiving your report, we will be in touch as per the Take Down Policy of the service.

Please note that personal data collected through this form is used and stored for the purposes of processing this report and communication with you.

If you are unable to report a concern about content via this form please contact the Service Owner.

Please enter an email address you wish to be contacted on. Please describe the unacceptable content in sufficient detail to allow us to locate it, and why you consider it to be unacceptable.
By submitting this report, you accept that it is accurate and that fraudulent or nuisance complaints may result in action by the University.

  Cancel