Any views expressed within media held on this service are those of the contributors, should not be taken as approved or endorsed by the University, and do not necessarily reflect the views of the University in respect of any particular issue.

David Ivo Galego – Final Toughts

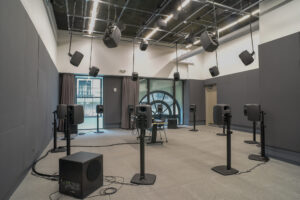
After roughly two months and a half, what first became a set of ideas, discussions and various points of view, questions have turned into answers and a “Place” was created to be presented on the 7th of April 2022 in the Atrium Room of Allison House. On this day, Echoes&Absences was finally showcased to everyone, and with it came a lot of reflections, room for improvement and concluding thoughts.

The large attendance achieved was initially desired, as the space was set out to be shared by a minor to reasonably large group, and the exhibition layout was designed to be discovered collectively. However, the celebratory mood among us developers and the audience may have hurt the sonic domain of the project since its soundscape was often easily masked by the expected sound of visitors chatting. Two thoughts arise from this: on the technical side, this could be perhaps resolved in a space with some second room layout that physically provided a more clear distinction between the exhibition/welcome hub and the actual immersive experience, and perhaps some acoustic isolation; However, when thinking on the exhibition as a “Place” of its own, these sonic interactions between people are an essential aspect to the soundscape, as the place becomes itself furthermore once people are also part of it.

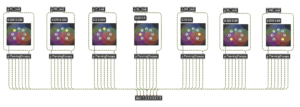
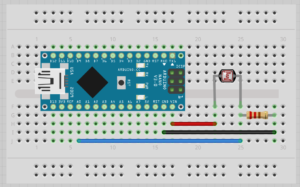
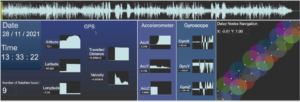
The exhibition’s interactive aspect also seemed desirable since this “on at a time” control surface appeared busy at all times and wildly explored by the individual. While observing the users’ behavioural patterns, some interesting improvement points came up. A wooden plank was given to users when interacting with the interface, with the sole purpose of better ultrasonic detection from the distance sensor; however, users would very commonly tilt, flip and explore the position of this plank instead exclusively of their own. Such a natural reaction led to re-thing a solution for future exhibitions, where instead of placing the Arduino system in a fixed position facing the user, put it on this plank. This solution would allow us to explore accelerometer and gyroscopic data on the Arduino, and if given walls for projection instead of screens, more surface and distance range values to explore.

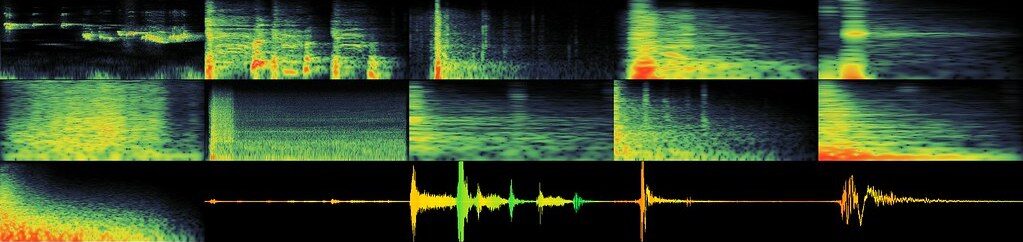
One last aspect seemed worthy of significant improvements. The sonic sculpture of this soundscape initially starts from recording the soundscape of the “News Steps” and then re-synthesised through the sonification of relevant data recorded on this sight. Until this point, the project had achieved a vital full circle of re-synthesis: all sonic outcomes were products of re-shaping the natural foundations of the New Steps. When it came to the nature of the interactive audio, even though spectrally fitting, this did not follow the same principle, which on the conceptual level breaks some of the re-synthesis value and the overall project. One easy way to improve this is to use sonic instances recorded on the sight where it all begins, such as stepping sounds, conversations and other relevant interactions. Another would be using the sensor’s data to trigger abrupt parameter changes on the Max/MSP project, re-synthesising the soundscape.

Overall, this project has allowed me to learn and explore the relationship between a location, its relation with time, and its points of contact with human perception, through methods of deconstruction and reconstruction. Breaking down and questioning the meaning of such intricate concepts of day-to-day life has allowed me to expand the notions of where reality starts and how we intend to perceive it to what my current notion seems limitless and never-ending.

I now acknowledge the tremendous efforts of my colleagues and my immense fortune of having had the opportunity to work and learn from such an incredible bunch. It has been my biggest of pleasures.

Until the next project,
David Ivo Galego

Sonification #6 – Project Files and Soundscape Demo

In this post, you can find a Link to the GitHub repository that contains all project files, including Max/MSP patch and point-cloud txt. data set, all audio files, and instructions on how to use them.

Echoes-Absences_MaxMspAndAudioFiles


Here you can also listen to a Demo file of the soundscape achieved through the Sonification work. Headphone listening is highly recommended.


If you’re reading this in order, please proceed to the next post: ‘Integrated Sound Triggering System #3 Interactive trigger sound design and production’.


Sonfication #5 – 7.1 Panning and Surround Sound Layout

The two last posts describe the signal flow of these sonification projects. We first reviewed its sonified granular re-synthesis and later the sonified heavy loop-processing performed in parallel. The repetition of these systems across the eight channels of a 7.1 surround sound layout was mentioned in both posts, a topic we shall now cover. Such concept, “7.1 surround sound”, not only describes the number of discrete output channels needed for this set-up but also includes a notion of spatial relationships between the qualities of these eight channels and the nature of their respective audio signals.

To successfully create a surround audio soundscape environment, breaking down the relationship between the listener and the soundscape is essential. The idea of soundscape positions any listener within itself, submerged in all directions, leading to the notion that the multitude of sources does not exclusively define the positional nature of a soundscape but, moreover, by the listener too. Even though the sense of direction, within the scope of the individual sonic event, comes from a single surrounding position, the grand composition of a soundscape is far more dependent on the listener’s location and orientation. The sonic place exists without the listener, yet to some extent, the listener defines how this is positionally perceived. On this note, it was mentioned in previous posts how the recording technique (2 pairs of A-B, facing opposite directions) of this soundscape defined a set of fixed positions, all with the same orientation. For each moment of the “stepped” recording, four positionally related audio files were produced together (Front-Left, Front-Right, Rear-Left and Rear-Right). Now the distribution across the eight channels of the 7.1 layout followed as such:

    • Front-Left –> Recording: Front-Left
    • Front-Right –> Recording: Front-Right
    • Centre –> Recording: Front-Left + Front-Right (MONO)
    • Side-Left –> Recording: Front-Left
    • Side-Right –> Recording: Front-Right
    • Rear-Left –> Recording: Rear-Left
    • Rear-Right –> Recording: Rear-Right
    • Subwoofer –> Recording: Front-Left + Front-Right (MONO)

Although the audio source layout was thought to be as described above, such a solution would still feel unnatural due to the discreetness per output channel. It would cause too harsh of a distinction between the different audio content. For example, the side channels would exclusively reproduce front-left/right recordings and no in-between with the rear ones. For a better solution, some 7-channel panning had to be designed to successfully mix gain values for each signal channel into correctly panned-out ones. As such, the design found a suitable answer by using node panels that can quickly provide a mix of values according to the relative position of a pointer, a solution found research on Cycle’74 Forums (Woodbury 2016). These panning systems were created for each of the 7.1 outputs using the same node layout with a respective pointer position. These panning units input an audio-file channel, like the ones listed above, and split into seven tracks of this audio signal with the correct gain values for each speaker position, providing an accurate, correct, smoother panned mix.

Figure 1- audio file partition followed by 7 channel Panning system

Once tuned to the room and the speaker set-up, this layout provided a surround sound environment emphasising a wide sonic front while keeping surrounding panoramic qualities with two dedicated rear channels. The output of these discrete channels was achieved using a [~dac 1 2 3 4 5 6 7 8] object, followed by dedicated volume faders.

With this 5th blog post, there is not much more on Sonification to document. However, the Max/MSP project designed for this effect later integrates the works of “interactive audio” and interfacing with visual components on a TouchDesigner domain. In these notes, more posts will follow through on these developments.

If you’re reading this in order, please proceed to the next post: ‘Sonification #6 – Project Files and Soundscape Demo’.

David Ivo Galego,

s2272270


REFFERENCES:

Woodbury L (13 April 2016) ‘Re: 7-channel Panning’ [Forum post comment], Cycling’74 Forums, accessed 23 March 2023.


Sonification #4 – Sonified Processing

The previous post documented what can be seen as the beginning sound block of the sonification piece, which replicates the same sonified granular system across the eight channels of a 7.1 surround system, each crossfading to a second on triggered for interactive audio replacement. By this stage, the sounding result is a texture with spectral qualities that feel similar to the high-fidelity soundscape capture but granularly rearranged, providing a first sense of acceptance and normality, followed by disorientation and pattern unrecognition when listening actively—a result of the interest of its own, and presented in the final result as such. However, further resynthesis and processing were desired, a linear variable that could morph between this first scenario and one other that felt otherworldly, hollow, and with an “upside down” feeling. This linear variable was achieved by designing a parallel crossfaded signal flow, with heavy processing between a delay line loop and a parallel reverb. This “morphing linear variable” was envisioned with the intent of interfacing with user-controlled gestures that will be explored in further blog posts.

A delay system can be achieved in Max/MSP by simply using a ~tapin and a ~tapout together, where the very common “Delay Time” parameter is defined through this second one. These two objects, on their own, however, do not sound “delayed” in the sense of the effect. Since these two objects delay an incoming signal once, no repetition of this instance will be heard. Therefore, and as commonly known across the common conception of a delay effect, a signal loop is built into this system with a signal multiplier factor between the value of 0 and 1, which as a variable is famously known as the “Feedback Amount”. With the feedback loop set, the signal gets re-delayed to silence like an expected “traditional” delay effect, and from this point, things get more interesting. By allocating other types of processing inside this loop, the effects will also get repeated accordingly. When these processing block’s parameters behave dynamically, things get really interesting. This way, we no longer solely loop an audio signal but also the effect of the processing blocks over time. In this project, three processing blocks are set, with there respective parameters:

    • A low-pass filter — Cut-off frequency;
    • A pitch shifter — Pitch;
    • And a tremolo/ring-modulator — Modulating frequency and Ramp Time;

Having this set-up settled, this dynamic behaviour that shapes sound in such interesting ways is provided by the method of sonification by assigning the fluctuations of the variable by the flowing data set and its factors (previously described in the past blog posts). After some experimentation and careful tuning over scale a smoothening, the sonification reflects over the following connections:

    • Delay Time –> R coordinate;
    • Feedback Amount –> Intensity; 
    • Cutoff Frequency –> G coordinate;
    • Pitch –> B coordinate;
    • Tremolo/Ring -Modulation modulator frequency –> X coordinate
    • Ramp time Tremolo/Ring -Modulation –> Y coordinate.

Another processing aspect of this parallel path in a crossfaded linear variable is a reverb unit inspired by the Cycle’74 example. With a fixed set of parameters, this reverb unit presents a very large, reflective-sounding place with a hollow and industrial feel. (Figure 1)

Figure 1 – Reverb Unit

As the last blog post mentioned, this system is set individually across each of the eight channels of the 7.1 surround sound system.

If you’re reading this in order, please proceed to the next post: ‘Sonfication #5 – 7.1 Panning and Surround Sound Layout’.

Sonfication #3 – Sonified Granular Synthesis

As mentioned in previous posts, the project’s interpretation and exploration of the concept of “place” starts with using point-cloud formats. The performed data export out of this format into text values (read the blog post “Sonification 2# – Interpolation and Data flow”) allowed us to understand the genesis of a point-cloud file and break down its meaning: a collection of points with a set of spatial coordinates XYZ, colour coordinates (RGBA) and an Intensity value (Reflectiveness). This understanding closely reminded the painting technique of pointillism. This technique uses single strokes or dashes of paint, each with characteristics (e.g. position on canvas, colour and texture) to paint the bigger picture.

The idea of a complex texture made of repeating the same gesture, yet each with different characteristics, naturally fell into the sonic granular synthesis technique. The sonic nature of granular synthesis seemed to fit the sculpting method of a point cloud better while also providing an exciting set of sonifiable parameters. It could also use the actual soundscape of the LiDAR recorded place, which seemed meaningful since this meant that the entirety of the sonification would come from recorded data of the defined site (the News Steps).

Figure 1 – Dr Tom Mudd base granular synth, 16 voice polyphony

The granular system bases itself on a Max/MSP patch provided last year by Dr Tom Mudd following the means of the Creative Coding course’s academic tools and resources up for grabs and further developments (Figure 1). This patch provides a way to trigger an audio buffer or a snipped-off while allocating this to a separate voice, collecting a max polyphony of 16 voices. This patch also provides a transposition factor (in semitones) t. Once triggered fast enough using a metronome, a sonic texture is formed. As described by the now, 4 sonifiable factors can are set:

      • Rate of grain playback (metronome rate)
      • Starting point within
      • Grain length
      • Transposition

It seemed essential for the starting point of the sample to be defined by the Z axis, for the sole reason of having sorted the data sets from “top-to-bottom” (read previous post “Sonification 2# – Interpolation and Data flow”), which allowed this parameter to still somewhat linearly scroll through the entirety of the audio buffer and be easily synced to the other granular channels, something discussed further down this post. Along with the “grain” starting point comes its length, which was set to oscillate along with a scaled B coordinate parameter between -5000 milliseconds and +5000 milliseconds, having on offset at 7000 milliseconds. The “grain triggering velocity” performed with a simple metronome, whose rate was set to follow a scaled value of the “Point Number” to oscillate between 100 milliseconds and 5000 milliseconds, a fluctuation that both fit well with the 16 voice polyphony and provided a consistent yet somewhat irregular texture. Finally, transposition followed the Intensity value, a decision made upon its very irregular and significant variation, which gives an interesting spectral composition to the polyphony.

The overall project is structured around a substantially more complex layout than a single use of one of these systems. As mentioned previously, an immersive dimension to the exhibition was set to be achieved through spatial recording techniques (2x A-B setup) in combination with a 7.1 surround sound setup. As such, this same patch is repeated over the eight distinct audio channels, where each has its specific audio buffer feeding the granular synth.

In previous planning, it was also set that there would be a user interface to control some moving in/back in time. This idea was defined to be represented through a system that allowed the processing of audio files specific to a timestamp in the day and that could replace the base audio samples with earlier or later ones in the day. This system meant a switch-type transition between the two files, where one replaces another on command, which usually would sound instantaneous and abrupt. To avoid this and instead develop slower morphing movement, for each 7.1 channel, two granular patches are set to be crossfaded between them once triggered. In this crossfading system, a function to clear the respective audio buffer when one’s signal matches zero was put into place, giving space for a new one. This interactive audio replacement system will be in-depth documented in a future Sonic Interactivity post.

Figure 2 -Crossfade System

The following blog post will review the heavy processing of this granular sound in parallel channels down the signal chain. A delay loop and a reverb set work together with the sonified data set to generate the other-worldly nature of this sonic work.
Many exciting sonification, methods and sounds are to come to this blog, and as such, we will keep you posted.

If you’re reading this in order, please proceed to the next post: ‘Sonification #4 – Sonified Processing’.

David Ivo Galego,
Head of Sonification.

Sonification #2 – Interpolation and Data Flow

After having a representative data set in a format and size that complied with the means and limits of Max/MSP, it was time to produce a reading system that interpolated data over a defined period or rate.

Where there is an oscillating variable, there are sonic opportunities. As such, the first goal within the Max/MSP domain was to have a discrete set of variables flowing over time, maintaining their representative interpolation. A Max/MSP patch for the data reading purposes of this project was envisioned to have the following capabilities:

          • Allow the upload of single text files and hold memory, respectively;
          • Provide some data flow over time;
          • Disaggregate and isolate variables into individual domains;
          • Provide control over the data flow rate;
          • Provide navigation across the interpolation of the uploaded data set;
          • Define a loop over the reading of the uploaded file;
          • Display monitoring visualisation;

Thanks to Dr Tom Mudd’s creative coding resources, provided in the academic year of 2021/2022, a Max patch was already available and up for use. This patch covered the first five topics described above. This patch surrounds a coll system that, when messaged “next”, outputs the aggregate data of an individual line (point) of the uploaded text over its integral order (in this case, z-axis top to bottom); in other words, reads the text file line by line. The triggering of “next” messaging can be rated through a metronome, that provides a simple and rather easy control over reading-rate. This coll object is also aware of line count, both inputting this data for navigation purposes and outputting it monitoring and with little work to trigger a loop back to the first line after reaching the 100.000th and last line (number of points in the file). The aggregate line data is then unfolded into individual domains with an “unpack” object, providing the desired variable isolation to proceed with their respective sonification.

Below presented are the mentioned “Coll” patch and the respective csv. reader.

The following post on Sonification will cover the granulation synthesis approach of the project and how samples are triggered and played back using this data set, the first method of Sonification.

If you’re reading this in order, please proceed to the next post: ‘Integrated Sound Triggering System #1 The function and structure of MAX’.

Sonification #1 – Data Collection, Treatment and Processing

Sonification understands as the use of sound to convey information or data. It transforms data, such as numbers or measurements, into sound signals or musical notes the listener can hear and interpret. As such, a rich and representative data set had to first come into place to develop the actual “sonifying” procedures further.

A point cloud scan based on a LiDAR scan, in its essence, is a recording of individual distance points from the source (the scanner) that are then correlated and represented together in space within a digital domain. For example, the project found that each scan performed with the Leica BLK-360 composes approximately 4 million points. For the aggregate collection of points to provide a high-fidelity capture of a given space, each of these points must contain there own set of common properties. Through CloudCompare software, we managed to understand that this set of properties corresponds to positional (XYZ) and colour (RGBA) coordinates, as well as an “Intensity” value that seems to correlate with the reflectiveness of the surface. While in cloud compare, we also learned ways to export the aggregate data set into its text format. It now meant that point cloud data could easily feed a Max/MSP system but also be treated and organised through an excel spreadsheet in meaningful ways towards the sonification procedures.

txt. export of point cloud data set

The ability to import this data set into excel allowed two crucial aspects, it allowed to create/calculate new variables and also allowed to organise data in a more meaningful and readable form. Both the text and the excel format presented a structure where each line composed a point, and with a total of 8 variable rows:

    1. X (x-axis coordinate)
    2. Y (y-axis coordinate)
    3. Z (z-axis coordinate)
    4. R (red colour coordinate)
    5. G (green colour coordinate)
    6. B (blue colour coordinate)
    7. A (alpha colour coordinate)
    8. Intensity (reflectiveness of surface)

We also observed that the point sequence was not correlated to any of the above parameters, which led to an understanding that this sequence followed the capture order over time. Since the sonification means fixed on the spatial qualities of the capture, the data set was re-ordered over the z-axis from top to bottom. However, this time-based variable was not completely disregarded. At first, to monitor the re-ordering operation, all of the lines were previously numbered, creating a point number variable. This new variable seemed interesting due to its rich uncorrelatedness to any other variables when ordered on a specific axis, so it was kept and later sonified. Other possible variables were imagined to be calculated, such as the respective vector or, if in the absolute value, the distance from the source. However, a set of nine variables already seemed plenty to work with.

The last aspect of the data treatment came from later learning the memory thresholds of the designed max patch (which will be discussed over the next few posts). Through trial and error, we found that the max patch could only hold an approximate maximum of 100.000 lines (txt. file). As previously stated, each scan recorded approximately 4 million points, and the achieved point cloud model composed a collection of 9 to 12 scans. This file size could never be processed through the methods used and the available resources. Luckily, CloudCompare provides downsampling tools that reduce the points evenly across the model to a desired amount, providing sonifiable-sized data whilst conserving the model’s integrity. Therefore the entire data collection and reorganising process described until now had to be performed for a downsample of 100.000 points.

This post reports the first step of many over the sonification task, and as such, more related posts will follow in the upcoming weeks.

If you’re reading this in order, please proceed to the next post: ‘Sonification #2 – Interpolation and Data Flow’.

David Ivo Galego (s2272270)


Sound Meeting #1

On the 23 Feb, the first Sound department meeting took place. All parts of the sound team attended the meeting and took part in its content. The session was structured across each sound task, as mentioned in the latest sound post. Each team member had the opportunity to catch up and show individual progress on their coordinated task. A collective effort also allowed for planning the future steps of each job.

This post will briefly attempt to overview the key topics, discussions, and decisions for each underlined sound task during this meeting. The meeting took place in the following order:

      1. Soundscape Capture: Proposal and Planning;
      2. Place Sonification: Data-Reading method demonstration and future Creative approaches;
      3. Sound Installation: Proposal Review and further planning;
      4. Interactive sound: Resources overview.

The meeting recording can be found here: DMSP Sound meeting #1 (2).vtt

Soundscape Capture

The soundscape capturing was the first task to take place as a topic of this meeting since it was agreed to be the current priority of the project since it envisions this to take its recording stage in the upcoming days. The respective coordinating member, Chenyu Li, presented this segment.

The presentation started off with laying off the possibilities for field-recording  methods along with the respective needed resources. A wide range of solutions came up:

      • Shotgun mic to record conversations by people on-sight;
      • Contact microphones to capture steps and rail handlings;
      • Matched Pair condensers for stereo recording;
      •  Ambisonic recording.

field recording initial plan

After some analysis, it was agreed that the ambisonic solution would face difficulties coping with envisioned set-up. Contact microphones would not be practical for capturing footsteps on stone surfaces, nor would the railing add significant sonic value to the final product. When it came to the shotgun mic solution, although of great interest, it brings up matters of ethics and privacy and therefore was set to be considered on-sight. The matched pair solution was agreed to be the main focus of the recording plans. Adding a second pair facing the opposite direction was further thought out to work a rear stereo image for the envisioned surround sound system. Therefore, the project plans to use pairs of Schoeps MK6(cardioid pattern)/MK4 small-diaphragm condenser microphones with a ZOOM F8 recorder.


Place Sonification

Place Sonification was presented by the coordinating member David Galego, who demonstrated current developments, followed by a discussion on future creative approaches for this part of the project.

XYZ+RGBA data reading patcher

The demonstrated methods showed how to export readable point cloud data for sonification and integrate these as parameters in a functioning MAX/MSP patch. This demonstration showed the following developments

      1. Exporting XYZ+RGBA data from cloud compare;
      2. Sorting XYZ+RGBA data in excel;
      3. Exporting XYZ+RGBA data from excel to readable txt. file;
      4. Integrate data into data reading MAX/MSP patch;
      5. Demonstration of patch functionalities and variable attribution.

The MAX/MSP demonstration patcher along with txt. file can be downloaded here: https://github.com/s2272270/PlaceSonification.git

After this demonstration, a discussion on the creative approach to the further development of the patcher came into place. This discussion reflected on two possible methods to sonify this data:

    • Processing/granulating the previously recorded soundscape;
    • Using parameters to generate sound through the means of MSP;

Although these approaches are not mutually exclusive, the sense of priority to either one or the other was the aspect under discussion. This discussion reached the coordinator member leaning towards processing methods, whereas the rest of the collective towards proper generative contexts. As such, it was set that the coordinator would bring up this discussion in the next general meeting with the Digital Design Media collective taking part in this reasoning since it was understood that the visual aspect and project concept play deciding factors in how it should sound.


Sound Installation

Sound Installation was presented by the coordinating member Yuanguang Zhu (YG). This segment reviewed aspects mentioned in the previous blog post, “YG – Preparation for Surround Sound Production”, posted on the 13th of February, 2023. After a careful review of aspects such as the envisioned system’s wiring design and set-up infrastructure, a series of factors were altered and agreed upon:

      • The collective understood that the speaker set-up should not be based on truss fixed points, as the respective truss mount kit will likely not be an available resource.
      • The collective identified a wiring incongruence between the proposed interface “RME Fireface UC/X” and the Genelec 8030A since the interface provides its analogue outputs as 1/4″ TRS, whereas the Genelec speakers input XLR.
      • The suggested interface, “RME FireFace UC/X”, does not provide a functional digital connection since it provides ADAT and coaxial ports instead of USB or CAT network protocols.
      •  The collective understood the field recording proposed solutions to be out of the scope of the task.

Therefore the collective suggested for this task look further along the following lines:

      • To plan a speaker set-up that is ground-stand based;
      • To look into interface options that provide at least 8 XLR DA outputs.
      • To look into an interface solution that provides a reliable digital connection such as USB, DANTE or standard CAT5e.
      • To look into a component that may allow tuning of the system.
      • To update the proposal in the post “YG – Preparation for Surround Sound Production”.

Having described the interface’s characteristics and the system’s need for tuning possibilities, the collective suggested looking into the possibility of having the university’s Digico SD11 mixing desk.


SD11

Interactive Sound

The Interactive Sound segment was presented by the coordinating member Xiaoquing XU.

This segment analysed the available resources for an Arduino system that could read the project’s envisioned user interaction (step-up/step-down), and turn it into a sonic response. While looking into different hardware possibilities, the ideal digital support agreed on was again MAX/MSP. After careful analysis and some discussion, the following solutions were understood as the most simple yet effective:

    • A Max/MSP patch that inputs two live contact microphones (one on each step) react once a certain dB threshold is surpassed.
    • An Arduino system that uses a sensor (distance sensor or light sensor) and feeds live data into a Max/MSP patch that can then be interpreted and sonified.

The collective advised the Arduino sensor option not only to be the most likely to present more accurate results but also to have various documented resources on how to perform these solutions, like the diagram presented below for using a light sensor.

Arduino + light sensor diagram
More sound meetings will occur in the upcoming weeks, so we will keep you posted.


The Sound Task Force

After some weeks of discussion and have decided on the project’s foundational concepts, understanding and structuring its sonic possibilities and defining the respective tasks seems appropriate. To quickly sum up the foundations of this project, the project will be composed of an exhibition, where an immersive experience of a pre-captured space (with LiDAR) will be displaced that users will explore through interactive methods. Through this brief, and after careful thought, the collective can identify four main sound-work domains:

      • Soundscape Capturing
      • Place Sonification
      • Interactive Sound 
      • Installation.

This is handy since the group comprises 4 Sound Design students, to whom these sound-work domains can be later assigned as roles.

Soundscape Capturing

The relationship between the concept of place and soundscape is crucial and interdependent. A place can be defined as a location with unique physical, cultural, and social characteristics. On the other hand, the soundscape refers to the acoustic environment that a person experiences in a particular place, including natural and human-made sounds. The soundscape contributes to our perception of a place, creating a sense of identity and atmosphere.

Capturing and reproducing the soundscape along with the place (through LiDAR) will play a critical role in shaping perception and understanding of the presented place. Therefore, it will probably be one of the first performed sound tasks for this project. The defined location of capture is sonically vibrant, having an urban profile sided with nature. It is composed of an extensive collection of elements that must be carefully thought out across all capture moments: planning, recording, and editing. This being said, through professional field-recording technology and carefully thought-out techniques, we propose to explore ways of best capturing this soundscape, having in mind its high-fidelity representation and the means of the entirety of the project along with its final form.

Place Sonification

One of the project’s core concepts to capture a location into point cloud data urges a new sound opportunity. A critical rule taught through the course and that here applies greatly: where there is audio, there is data, and where there is data, there can always be audio.

Grain River – Project that sonifies recorded GPS/Accelerometer data (Galego, 2021)

One aspect of sound art is data sonification, which involves transforming data into sound to make it more accessible and to enhance its representation. In data sonification, data points are mapped to specific sound parameters, such as pitch, frequency, and volume. This creates a sonic representation of the data that can reveal patterns, trends, and relationships in ways that might not be immediately apparent through visual means. Sound art that employs data sonification can range from immersive installations to interactive pieces and has the potential to offer new perspectives on data and provide a unique and engaging form of artistic expression.
This being said, point cloud data can be turned into quantifiable formats such as XYZ and RGB and exported into an xml. file. The resultant xml. file can be converted into txt. file and be fed to a Max/MSP patch that reads these numbers. From here, through computational sound composing, data will generate a meaningful sound-art piece that represents the recorded place. In a sense, letting the physical shape of the site perform a new soundscape. This method could also play along with the recorded soundscape audio, where this high-fidelity representation can be processed and re-shaped according to the point cloud data sets.

Interactive Sound

As stated previously, the user will perform some degree of interactivity with the exhibition. Users will interact through a control system that takes in a relatively simple gesture (stepping up or down). Although simple, this represents a decision-making process of the user, which on its terms, presents multiple sets of data:

    • outcome A
    • outcome B
    •  similarity to a past outcome
    • dissimilarity to a past outcome

Such parameters can be represented by quantified data and be sonified through Max/MSP. Perhaps one other form of sonification would be to use unity/unreal for this purpose, which along with middleware like Wwise or Fmod, could work sound in exciting and varied ways. This task, however, will demand the crucial point of finding the optimal way to read live data from this simplistic control and manage a system that is optimal for such a purpose.

Installation

As stated previously, the final presented product of this project will be an exhibition, in the sense that it will use space to deliver an audio-visual product. This premise demands the installation factor for both Audio and Visual domains. Now, it is also clearly stated that the project proposes an immersive experience. On the one hand, this “immersive” label narrows down the installation options. On the other hand, it demands innovative and creative solutions.

Installation is the task that, for the most part, is thought out as the last step when it is not. It plays with various factors that must be planned, measured, tested and improved. It accounts for the type of audio to playback, the space being used, and most importantly, the listener, both as an individual and the audience. The installation must be thought out early in the project and improved along the project developments and must account for all the different needs that might occur over time.

Two possible solutions come to mind for the “immersive exhibition” concern of the project: a multichannel surround sound speaker set-up or an ambisonic solution with a binaural format. However, although ambisonics provides powerful ways to create immersive experiences, it also demands more resources and would not offer a simple solution for the different possible orientations of the listener. Therefore, a multichannel surround sound system seems more appropriate as this can more easily be adapted and tuned to the ongoing project’s needs.


Exploring LiDAR as a Group


It was now time to test and understand LiDAR in its full capacity. For the group’s first interactions with LiDAR we decided to experiment with Leica BLK360 on a larger scale, the ECA Sculpture Court.

Described as “the neo-classical heart of the Main Building”, ECA Sculpture Court is a large room commonly used for exhibitions and other events. It presents a second floor with a balcony-gallery layout, which provides the opportunity to experiment scan-alignment at different heights. And, whenever not used for exhibitions, it presents a large clear out area, with lot of surface for experimentation, the ideal set-up to get to know LiDAR technology better.


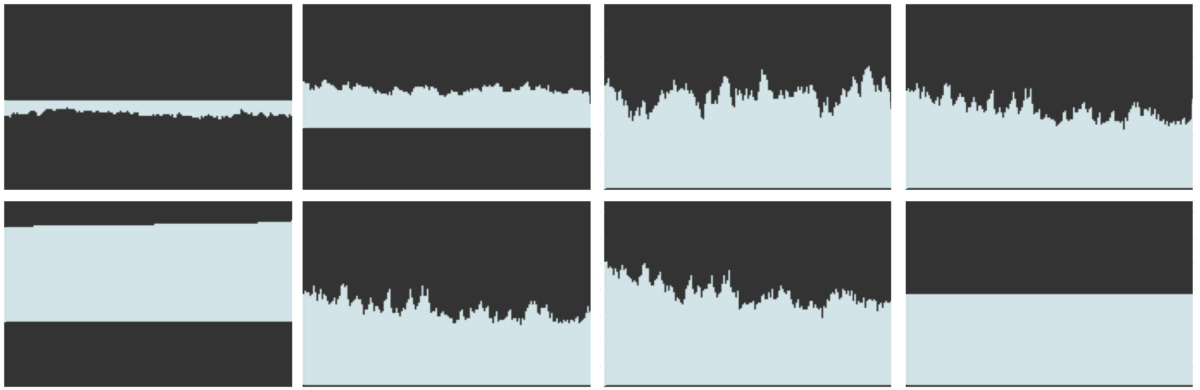
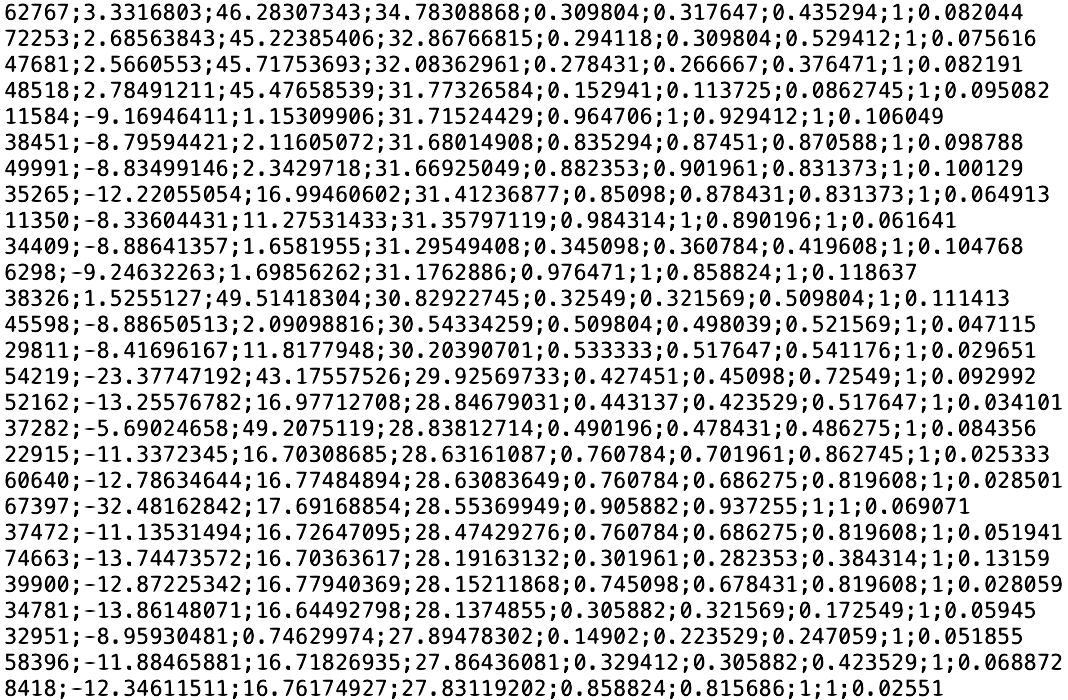
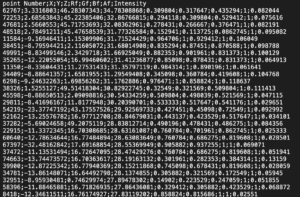
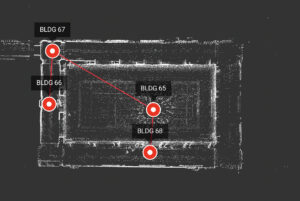
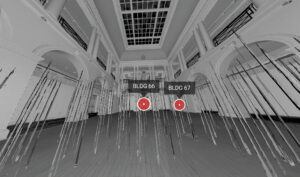
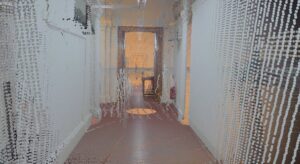
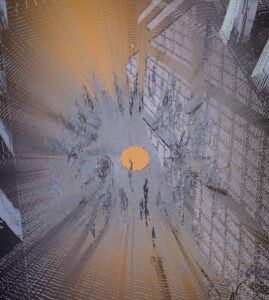
Across this experimentation four scans were performed, each by a different member of the group. The first, positioned in the center of the room, the
group suggested to get creative. During the entire scan of 6 minutes 50 seconds , we, about 8 people, moved together in circles around the scanner,
sometimes inverting direction. The intention behind was to understand how the scan copes with the presence of human movement. Once the scan
revealed itself, the results were receiver as a wonderful surprise to all. It
showed an undefined circular pattern around its blind-spot, something that look somewhat ritual of the spirit world, around a void . Thus, it was an important practice to understand how this technology, commonly used for technical purposes, could also be used as some sort of a creative tool.

The following to scans were performed in the gallery areas, with the intent of both further understand the scan alignment procedures, and compare how the scan performs under more inclosed spaces. As expected we concluded that, more enclosed spaces lead to more concentrated point clouds, and therefore a more detailed representation of the surfaces. We got also to understand, that the “automatic prei-alignement” feature (Cyclone 360 app) can only be effective within lines of sight between two different scan positions.


Lastly, we moved to the second floor balcony, with direct sight over the first central scanned position. This scan was performed with the intent of understanding if the scan alignment could be performed at various height levels. Although we managed to make it happen through manual alignment, it seemed that this specific device is not designed for such without the help of external software.


Summing up. After testing the LiDAR scanner, at a larger scale, we can now understand how effective it can be for capturing large infrastructures, and the right techniques to do so. We also found that this technical device can be used as a creative tool, through more unconventional and experimental practices, that could enrich the project greatly. We also understood, how the device has its own limitations, and how this come be overcome through the use of external software.


More interesting findings and explorations will soon come, and so we’ll keep you posted.

css.php

Report this page

To report inappropriate content on this page, please use the form below. Upon receiving your report, we will be in touch as per the Take Down Policy of the service.

Please note that personal data collected through this form is used and stored for the purposes of processing this report and communication with you.

If you are unable to report a concern about content via this form please contact the Service Owner.

Please enter an email address you wish to be contacted on. Please describe the unacceptable content in sufficient detail to allow us to locate it, and why you consider it to be unacceptable.
By submitting this report, you accept that it is accurate and that fraudulent or nuisance complaints may result in action by the University.

  Cancel