Any views expressed within media held on this service are those of the contributors, should not be taken as approved or endorsed by the University, and do not necessarily reflect the views of the University in respect of any particular issue.

Point cloud data processing with CloudCompare #2 – Exporting point cloud files

In order to export point cloud files to TouchDesigner for further processing, we can choose between ply, xyz and csv formats for export. By looking up some information, I have listed the characteristics of the three formats.

PLY (Polygon File Format):

  • PLY is a versatile 3D model file format primarily used for storing 3D scan data and mesh data.
  • It can store point coordinates (x, y, z), color information (r, g, b), normal information (nx, ny, nz), and face data, among other attributes.
  • PLY comes in two formats: ASCII and binary. The ASCII format is more human-readable but has a larger file size, while the binary format has a smaller file size but is harder to read.
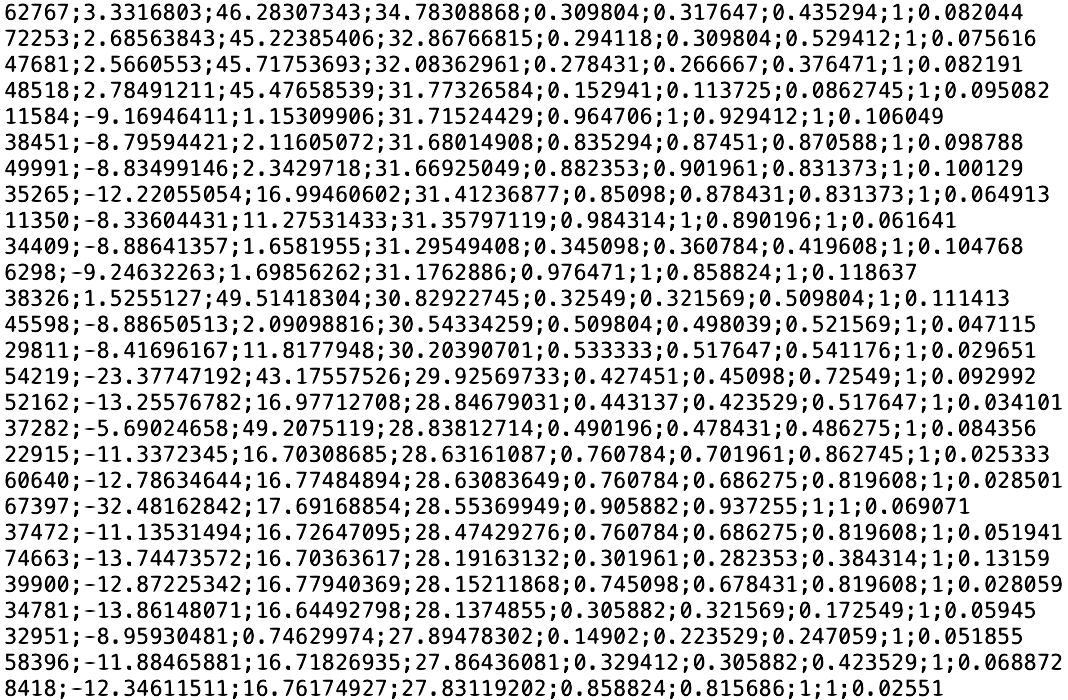
XYZ:

  • XYZ is a simple text format mainly used for storing point cloud data.
  • It only stores point coordinates (x, y, z), and sometimes includes color information (r, g, b).
  • The format is simple, easy to read, and edit but does not support storing face data or normal information.

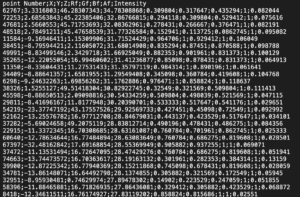
CSV (Comma Separated Values):

  • CSV is a versatile text format used for storing tabular data and can be used for saving point cloud data.
  • It can store point coordinates (x, y, z), color information (r, g, b), normal information (nx, ny, nz), etc., but requires custom column order and definitions.
  • Similar to the XYZ format, it is easy to read and edit but does not support storing face data.

In summary, all three of the above formats were suitable for this project, but after testing and comparing them, we finally chose the plv format for export, taking into account file size and loading speed.


Reference list

Meijer, C., Goncalves, R., Renaud, N., Andela, B., Dzigan, Y., Diblen, F., Ranguelova, E., van den Oord, G., Grootes, M.W., Nattino, F., Ku, O. and Koma, Z. (2022). Laserchicken: toolkit for ALS point clouds. [online] GitHub. Available at: https://github.com/eEcoLiDAR/laserchicken/blob/master/Data_Formats_README.md [Accessed 27 Apr. 2023].

Yuxuan Guo

The Day of Sound Material Recording

On 3 March, the audio team recorded the sound material. The audio crew woke up at 5 a.m. and arrived at The New Steps by 6 a.m. Once the recording system was fully set up, the audio team recorded audio at various times. While recording two pairs of stereo microphones, the audio team also recorded some scene-specific sounds using strong directional shotgun microphones to achieve the specific scenes required for the project.

All members of the audio team did our best to achieve a satisfactory sound for this recording, which lasted for about a morning. In the afternoon the Place group had a tutorial session and also discussed the sensors in the interactive audio section.

All the recorded sounds are now in the editing stage.

The Day of Recording Tests

In order to achieve the Place team’s expectation for the project, the DMSP audio team booked audio recording equipment and had a test recording session at The New Steps on the afternoon of 2 March.

During the test recordings, the audio team evaluated the quality of the recordings and made some settings to get the best quality recordings as possible. The audio team identified two main issues during the tests. One was that the recording location was narrow and windy, so there was some wind noise recorded with two pairs of stereo microphones, so the audio team discussed a solution to reduce the wind noise and address the effects of wind noise as much as possible. The other problem was that the MixPre recorder was running out of battery power so quickly that the four sets of batteries that the audio team had prepared for the recording were almost dead within half an hour, so the audio team decided to use a computer to power the recorder on the day of the recording in order to extend the recording time and ensure that the recording went smoothly.

Molly Munro

Sonification #2 – Interpolation and Data Flow

After having a representative data set in a format and size that complied with the means and limits of Max/MSP, it was time to produce a reading system that interpolated data over a defined period or rate.

Where there is an oscillating variable, there are sonic opportunities. As such, the first goal within the Max/MSP domain was to have a discrete set of variables flowing over time, maintaining their representative interpolation. A Max/MSP patch for the data reading purposes of this project was envisioned to have the following capabilities:

          • Allow the upload of single text files and hold memory, respectively;
          • Provide some data flow over time;
          • Disaggregate and isolate variables into individual domains;
          • Provide control over the data flow rate;
          • Provide navigation across the interpolation of the uploaded data set;
          • Define a loop over the reading of the uploaded file;
          • Display monitoring visualisation;

Thanks to Dr Tom Mudd’s creative coding resources, provided in the academic year of 2021/2022, a Max patch was already available and up for use. This patch covered the first five topics described above. This patch surrounds a coll system that, when messaged “next”, outputs the aggregate data of an individual line (point) of the uploaded text over its integral order (in this case, z-axis top to bottom); in other words, reads the text file line by line. The triggering of “next” messaging can be rated through a metronome, that provides a simple and rather easy control over reading-rate. This coll object is also aware of line count, both inputting this data for navigation purposes and outputting it monitoring and with little work to trigger a loop back to the first line after reaching the 100.000th and last line (number of points in the file). The aggregate line data is then unfolded into individual domains with an “unpack” object, providing the desired variable isolation to proceed with their respective sonification.

Below presented are the mentioned “Coll” patch and the respective csv. reader.

The following post on Sonification will cover the granulation synthesis approach of the project and how samples are triggered and played back using this data set, the first method of Sonification.

If you’re reading this in order, please proceed to the next post: ‘Integrated Sound Triggering System #1 The function and structure of MAX’.

Point cloud data processing with CloudCompare #1 – Editing

After data collection using lidar, an e57 format point cloud file was generated. In order to further process the data, we chose to use CloudCompare to edit the point cloud files.

Reducing points

On the first attempt, because the data collected was of the highest quality when importing the file into CloudCompare, the file was too large, making it difficult for our computer to edit it. Therefore, we need to reduce the number of points in the data. In CloudCompare, this operation can be performed by sub-sampling, and in sub-sampling you can select the random method to customize the number of points after resampling and complete the reduction.

For subsequent data acquisition, we selected a medium-quality setting for scanning, reducing the process of handling the data and avoiding excessive loading times once in the software.


Separate scenes

The scene we are scanning is The New Steps in Edinburgh, a section that includes a staircase with a 90-degree angle, a wooded area, and a building adjacent to the staircase.

In order to make it easier to design the data in other software, we chose to split the scene into three scenes: a separate wooded scene, a staircase with buildings removed in the first half, and a staircase with buildings in the second half.

To complete the operation above, the segment tool is required in CloudCompare. For the specific operation method, I referred to the video tutorial by EveryPoint(2021). Clicking on this tool draws a polygon on the screen which can be mapped to the 3D scene where the point cloud is located. The user has the option to delete all points within or outside the mapped range of the polygon.

As it is not possible in CloudCompare to directly select different points in the 3D scene for processing as in other 3D software, nor is it possible to use shortcuts to select individual vertical or horizontal axes to rotate the scene. Editing the scene becomes extremely challenging, especially as the branches of the trees in the scene have spilled over the stairs and the fence. Dozens of separate pruning operations at different angles are required to sort out a clean scene. This took me a lot of time, but the result was quite good.

before:

After:


Since subsequent point cloud color adjustments and camera animations need to be made in TouchDesigner, it is sufficient to export the point cloud to a format supported by TouchDesigner (ply, csv, xyz) after the separation of the scene has been completed.


Reference list

EveryPoint (2021). How to Quickly Align and Merge Two Point Clouds in CloudCompare. [online] www.youtube.com. Available at: https://www.youtube.com/watch?v=0OcN-lNChlA [Accessed 27 Apr. 2023].

Yuxuan Guo

Sonification #1 – Data Collection, Treatment and Processing

Sonification understands as the use of sound to convey information or data. It transforms data, such as numbers or measurements, into sound signals or musical notes the listener can hear and interpret. As such, a rich and representative data set had to first come into place to develop the actual “sonifying” procedures further.

A point cloud scan based on a LiDAR scan, in its essence, is a recording of individual distance points from the source (the scanner) that are then correlated and represented together in space within a digital domain. For example, the project found that each scan performed with the Leica BLK-360 composes approximately 4 million points. For the aggregate collection of points to provide a high-fidelity capture of a given space, each of these points must contain there own set of common properties. Through CloudCompare software, we managed to understand that this set of properties corresponds to positional (XYZ) and colour (RGBA) coordinates, as well as an “Intensity” value that seems to correlate with the reflectiveness of the surface. While in cloud compare, we also learned ways to export the aggregate data set into its text format. It now meant that point cloud data could easily feed a Max/MSP system but also be treated and organised through an excel spreadsheet in meaningful ways towards the sonification procedures.

txt. export of point cloud data set

The ability to import this data set into excel allowed two crucial aspects, it allowed to create/calculate new variables and also allowed to organise data in a more meaningful and readable form. Both the text and the excel format presented a structure where each line composed a point, and with a total of 8 variable rows:

    1. X (x-axis coordinate)
    2. Y (y-axis coordinate)
    3. Z (z-axis coordinate)
    4. R (red colour coordinate)
    5. G (green colour coordinate)
    6. B (blue colour coordinate)
    7. A (alpha colour coordinate)
    8. Intensity (reflectiveness of surface)

We also observed that the point sequence was not correlated to any of the above parameters, which led to an understanding that this sequence followed the capture order over time. Since the sonification means fixed on the spatial qualities of the capture, the data set was re-ordered over the z-axis from top to bottom. However, this time-based variable was not completely disregarded. At first, to monitor the re-ordering operation, all of the lines were previously numbered, creating a point number variable. This new variable seemed interesting due to its rich uncorrelatedness to any other variables when ordered on a specific axis, so it was kept and later sonified. Other possible variables were imagined to be calculated, such as the respective vector or, if in the absolute value, the distance from the source. However, a set of nine variables already seemed plenty to work with.

The last aspect of the data treatment came from later learning the memory thresholds of the designed max patch (which will be discussed over the next few posts). Through trial and error, we found that the max patch could only hold an approximate maximum of 100.000 lines (txt. file). As previously stated, each scan recorded approximately 4 million points, and the achieved point cloud model composed a collection of 9 to 12 scans. This file size could never be processed through the methods used and the available resources. Luckily, CloudCompare provides downsampling tools that reduce the points evenly across the model to a desired amount, providing sonifiable-sized data whilst conserving the model’s integrity. Therefore the entire data collection and reorganising process described until now had to be performed for a downsample of 100.000 points.

This post reports the first step of many over the sonification task, and as such, more related posts will follow in the upcoming weeks.

If you’re reading this in order, please proceed to the next post: ‘Sonification #2 – Interpolation and Data Flow’.

David Ivo Galego (s2272270)


The New Steps Research


I have started doing a little digging into the history of The New Steps which are located in Old Town, Edinburgh. So far the search has been quite disappointing, as I can’t seem to find any relevant information online, the most I have gotten is a tourism blog talking about them as one more spot to visit during their travels to the city.

So I decided to start looking elsewhere, in this case, the National Library of Scotland. My first step was to start looking at old city maps to try and find the exact spot the stairs are, and the library website has a really handy tool of begin able to look at maps side to side. With this, I was able to locate the stairs on several maps going from 1892 forward, as older maps have the general streets, but the stairs are not shown anywhere.

In one of the older maps that I found from 1892-1905, there is displayed a staircase similar to what The New Staris are today, with just part of them not matching the actual route, so it could be said they have been there, but slightly altered through the years. I can say they are The New Steps, as the entry point both on the top and the bottom are the same, it’s just the path they take is slightly different.

In the screenshot below we can see how the stairs are represented in the map of Edinburgh.

Map Name: OS 25 Inch, 1892-1905

Map Name: OS 1:1, 250/1:2,500, 1944-1971

I did however find a comment in a tourism blog about them, but at the moment I don’t have any references to confirm if this information is viable.
The New Steps were built in 1869 when St. Guiles Street was laid out in the present form. And they were called The New Steps because The Evening News had an office in the building to the left of number 19. You would walk through a vennel, an open-air passageway, where number 19 now stands, and climb three sections with eight flights of stairs to St. Guiles Street. In 1928, hence the date of the building The Evening News building was extended and took over the area the steps started in. The steps were realigned and if you move Google Maps with one right click you can see the present start of the steps with the light above the entrance.  I don’t have any way to reference this information, nor do I know if it’s true, yet.
Looking at the dates of the maps, and the dates the Evening News building was extended, it makes sense the change in the path found in the maps.

I’m looking to find some reliable sources to confirm the history of the steps, for this, I have asked for help from one of the librarians, and they kindly told me they were gonna do some digging and come back to me with any information relevant.

The Library reached out to me after a weekend and confirmed my suspicions about the history of the steps. The librarian did some research in different books, but same as me there was not much information about the place.


If you’re reading this in order, please proceed to the next post: ‘Meeting’.

Daniela M

Chaos and Places


The book “Chaos, Territory, Art” delves into the ontology of art, exploring its material and conceptual structures. According to Gilles Deleuze, art doesn’t create concepts but rather responds to issues and provocations, creating feelings, affects, and intensities that correlate with and link to ideas. The book’s opening contemplates the notion of chaos and how its forces can be distinguished, leading to the creation of the universe, art, and living. Sensation is a concept that exists in the relationship between the subject and the universe before any understanding, perception, or intellect, and where these elements are in constant flux.

“Art can create sensations from chaos, and through the entwined relationship between body and universe, entwined in mutual concavity/convexity, floating/falling, folding/unfolding are directly touched by that out- side now enframed, creating sensation from their coming together.”

Grosz explores the relationship between chaos and territory as it relates to the production and reception of art. She draws on the philosophical concepts of Gilles Deleuze to develop her ideas about the relationship between art and the environment. For Grosz, “chaos” refers to the dynamic and unpredictable nature of the world around us. She argues that the environment is constantly changing and that it is shaped by a variety of forces, including geological, biological, and cultural factors. In this sense, chaos represents the non-linear, non-hierarchical, and open-ended nature of the world.

In contrast, “territory” refers to the ways in which we impose order and structure on the chaos of the environment. Territory is the process of creating boundaries, defining spaces, and organizing the world around us. According to Grosz, territory is a way of making sense of the chaos of the environment, and of creating a sense of stability and order. In this context, a “place” is a specific location or environment that has been territorially defined. A place can be a physical location, such as a city or a natural landscape, or it can be a social or cultural space, such as a community or a tradition. According to Grosz, a place is not simply a passive backdrop for artistic production and reception, but rather an active and dynamic force that shapes the way we think about and engage with art. Overall, Grosz’s work on chaos, territory, and art emphasizes the importance of understanding the ways in which the environment shapes artistic production and reception, and of recognizing the dynamic and complex relationship between art and the world around us.

In the case of our project, we are working out how can we show the spectators the chaos of the world we are living in? How the places we inhabit change by the very own nature of the world, and by our own interaction with it in a non-linear way. How the steps passing thru time keep changing, evolving the environment they are surrounded and are part of, and the way they are keeping up with the changes of the city and the people who pass thru time and space. We want to create a representation of this, the chaos of the world, and the transformation it has over time and space. In our exhibition, the digital animations of the scans will be representing this evolution of the new stairs, while at the same time will be showing a new unexplored dimension.

Daniela, ChatGPT Feb 13 Version


References

Grosz, E.A. (2008). Chaos, territory, art : Deleuze and the framing of the earth. New York, Ny: Columbia University Press, Cop.

Project Thoughts


How do we connect real-life places with those that are digitally produced?

The connection itself is the place or the essence of the place we are trying to transmit. Even if we only take a certain part of it to represent the main idea, it is there. We cannot create this new dimension without heavily basing it on a real-life place. So what exactly makes it real now? One can say that the added meaning given by the creators (us) of this new dimension gives the user a new perspective of looking through the eyes of another person and being able to visually see the representation of someone else’s mind, transmitted and transplanted onto the new dimension of the non-existent new plane of the place it was based on.

So what is the purpose of this exhibition?

For the user to explore new ways of seeing the world through the digital tools we have provided. Not only are we transforming the world we live in by scanning the new steps and digitally creating its doppelgänger, but we have also created a new, different dimension of it. We are combining this real place and these modifications of digitally altered places to help the user explore all the possibilities that exist in this dimension.

How can the spectator create a significant connection with our exhibition if the place we are showing is not real?

Well, that’s where some people might differ, as it is a real place, and it’s characteristically a place that it’s known in Edinburgh, full of stories, journeys, messages, and different people passing by every single day. It’s a bridge/path/staircase from one part of the city to the other, it connects us all together., each user will have a different meaning/idea of this place.

At what point does this new dimension become a fantasy, an unattainable dream from its creators?

The truth is, no matter what we might think, once we have created these beautiful, transformed, and carefully curated non-places based on the new steps, they become a reality, even if the reality only exists digitally. Once the user experiences the sensations that we have designed them to feel, it becomes alive. It will never cease to exist as it now lives within the minds and personal experiences of each of the users. We might not fully know what perspective each user has embedded in their mind, but that’s the beauty of this: each individual will create their own personal version of this sensory experience.

Emotions are what make a space a place (Eleni, 2023)

Daniela

css.php

Report this page

To report inappropriate content on this page, please use the form below. Upon receiving your report, we will be in touch as per the Take Down Policy of the service.

Please note that personal data collected through this form is used and stored for the purposes of processing this report and communication with you.

If you are unable to report a concern about content via this form please contact the Service Owner.

Please enter an email address you wish to be contacted on. Please describe the unacceptable content in sufficient detail to allow us to locate it, and why you consider it to be unacceptable.
By submitting this report, you accept that it is accurate and that fraudulent or nuisance complaints may result in action by the University.

  Cancel