https://1drv.ms/b/c/4d1197ded0e122fd/EQv55uRHIJpPqGym6o1jYrYBA9jQhBpnym89l2YBHYDcVA?e=Vh4laW
https://1drv.ms/b/c/4d1197ded0e122fd/EQv55uRHIJpPqGym6o1jYrYBA9jQhBpnym89l2YBHYDcVA?e=Vh4laW
2025.2.12
Since the project involves tides, the sound part must include the sound element of waves.
In the early stage of the project, we simply used three relatively different sounds, which lacked interactivity. In order to achieve the purpose of the installation, we need to let the audience feel the influence of tidal forces. When pushing the planet, the sound of the waves will also change. It should be interactive, not static.
2025.2.25
So the direction of our wave sound effect design is to enhance the changes of the wave sound effect while ensuring the auditory experience.
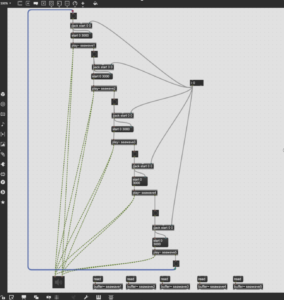
First, we tried to use a method similar to the simulated particle synthesizer in max to edit a wave sound effect into multiple sound clips with a duration of 5s. Then there is a variable to determine its playback time and end time. When we want the waves to have obvious changes, each one starts from the first second and ends in the second second. (At that time, it was not decided whether to use the distance variable between the planets or the speed variable of the planets). The logic diagram is as follows:
3.20
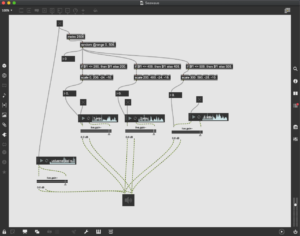
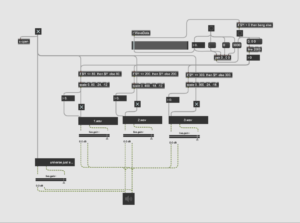
After Jules’s reminder, we thought it would be more convenient to mix the complete long audio together, so we made a new design for the changes in the waves. We mixed three long, complete, and different waves together, and used the size of the variable to affect the volume changes of the three audios, so that the sound quality is also good while the waves are changing.
The Max demo at that time was as follows: Design, mixed three long, complete, and different waves together, and used the size of the variable to affect the volume changes of the three audios, so that the sound quality is also good while the waves are changing.
The Max demo at that time was as follows:
The max demo at that time was as follows:
3.23
In the end we decided to use the speed of movement between the planets and the Earth as a variable affecting the sound of the waves, and merged this part into the final Max patch along with the music and other interactive parts.
The final edited sound of the waves are as follows:
1.Wave_1
2.Wave_2
3.Wave_3
Music & Soundscape
Each track represents a different orb, combining a generated musical element with atmospheric planetary sounds. Each planet has three VST instruments that are receiving MIDI from MAX, generated algorithmically in response to user interactions with the system.
Full Music Track: generated entirely by audience input through the three sensors into the MAX MIDI machine:
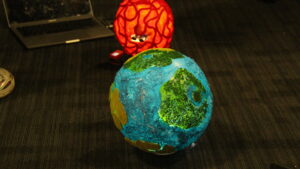
Earth: waves, whale song, the universe atmos:
Metal: rhythmic percussion, stuttering and fizzing metalic screeching:
Lava: distorted cello, fire, bubbles
Gas: wind, low flute and whistle melody
Music, Processing, and Mixing: Fraser
Soundscapes & Atmospheres: Shu & Fulong
Design Process
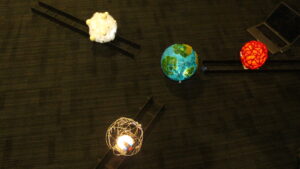
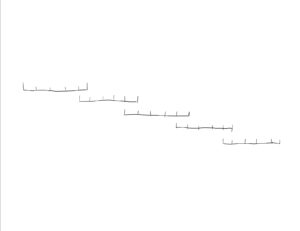
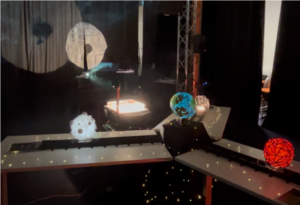
We decided on using the Atrium, as it had a projector and metal rig that black drapes could be hung from. Another advantage to using the atrium was the four speakers we could connect to through the house audio system. This decision allowed us to make basic layout diagrams: the first shows lose-up of the central planet and moons, the second zooms out, showing the three drapes and two projectors, and the third featuring side projectors.
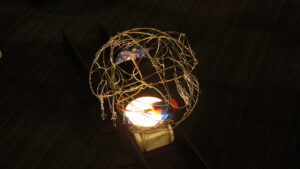
Based on our research into planet types, we chose to design a gas giant, a metal orb and a molten lava planet. Each planet would sit on top of a light fastened to a set of 3D printed wheels. Caitlin and Yannis also built need tracks to keep each planet still when it was not being moved by and audience member.
Technology: Data Flow
We want the representation of these celestial movements to go beyond just a soundscape. It should also reflect the natural gravitational pull between the Sun and the Moon. Through our interactive music system, we aim to let the audience intuitively feel the tension and fluctuations of gravitational forces, translating these cosmic interactions into an immersive auditory experience.
Our final solution was to connect the ultrasonic sensor using M5StickC Plus. VCC, GND, and SIG pins of the Grove ultrasonic sensor, which transmit the data to 5V, GND, and GPIO 26 of the M5StickC Plus, respectively. The computer connects to each stick via UDP protocol, and a Python script written by Lulu turns the data into OSC compliant data, and then transmits it to the Max/MSP patch.
Within MAX we calculate the tidal forces generated by the audience’s adjustments to the positions of the Sun and Moon. The tidal force is determined using the following formula:
Ft = 2GMR / d3
Where Ft is the tidal force, G is the gravitational constant, M is the mass of the orb, R is the radius of the Earth, and d is the distance of the orb to the Earth. We map these tidal forces to various dimensions: the volume of the atmosphere for each orb increases as distance decreases, wave sounds are triggered based on the rate of change of the distance of any orb, and the resultant gravitational force and vector are calculated for the musical generation side of the MAX patch.
Summary notes by Fraser David Macdonald.
Abstract
Over the past century, technologies and visualisations have been combined by artists and scientists, to explain their discoveries and theories, and to educate and enhance our knowledge of the universe
Through this journey the public have seen diagrams and drawings of the known universe, then photographs of our solar system, eventually of far planets and solar systems, and most recently, images of black holes, renders of gravitational waves, and pictures of the furthest corners of the galaxy. The image on the opening page is the galaxy LEDA 48062 in the constellation Perseus, 30 million light-years from Earth, and its neighbour galaxy UGC 8603, and the image on the contents page is part of the Eagle Nebula, 7000 light-years away. Both images are visualisations of data as much as they are photographs: infra-red and ultraviolet light is brought into the visual spectrum, and interesting features are enhanced, to further our understanding and experience of the image, transforming the way in which we perceive and evaluate our universe and role within it.
Across the creative industry artists are looking to science, data, and mathematics to inspire their creations, working to make esoteric and complex discoveries more accessible and understandable. This project seeks to explore this boundary between the arts and academia, personal and universal, and to produce a piece of work illuminating the magnitude of space and exploring what lies beyond human perception. Our immersive installation, ‘The Breath of the Machine’ allows the audience to control the form of their universe, immersing them in heat, gas, and metal, with visual projections and reactive soundscapes, changing with the gravitational tidal force. By engaging with the ebb and flow of tidal forces, they can experience the tension, release, and rhythmic variations driven by these celestial interactions.
Research
Our starting point for this project was perception, and as we considered the relationship between sound, time, and scale, we found ourselves naturally drawn to cosmic ideas of moon and tides, planets and gravity. Then we used these abstract ideas to imagine an immersive experience, and how we might engage with light, colour, sound, and texture to represent these ideas. As individuals we researched around these themes, before combining ideas as a group to form the scope for our final project. To explore perception of light and darkness, we considered an installation with moving projectors, that would lengthen and shorten the shadows of objects and of the audience. We also considered an interactive wall, with chaotic ripples, and reactions of colour and sound. Our cosmic ideas led us to consider the moon, our tides, and how we can perceive waves, and water.
Nature and nurture, combined with active factors including distraction and attention, emotion and mood, and our immediate surroundings, affect how we perceive the world around us, changing how we behave, and even the rate at which we perceive time to be passing. Author and philosopher Bruce Kreiger compares the desire to understand our self and our biology with our exploration of the universe and cosmological theories, writing that the process of understanding how any one of these mechanisms functions, deepens our understanding of the entire system, and changes our interaction with the world around us.
‘This reminds us that our understanding of the universe is not a direct reflection of reality but rather the result of a complex process of interpreting data through the prism of our sensory systems and cognitive structures.’
– Bruce Kriger: ‘The Limits of Perception’
By exploring the universe, we have changed our sense of self, placing ourselves within a solar system in a galaxy in the cosmos. The scale of the universe is so massive that we cannot perceive it in the same way as we do with regular distances. We know and can visualise mentally the size of one centimetre, or inch. The same can be said for a foot or meter, kilometre or mile, however if one tries to picture 10,000km or miles, it becomes much harder to visualise. When we try to imagine a universe that is 93 billion light-years wide, it feels ‘out-with’ the realms of scale: on the border between finite and infinite. It can be a humbling experience to learn more about the universe and our place within it, but it can also be a source of great awe and inspiration.
‘The reality of the universe exists prior to and independent of its being perceived, but when it is perceived, the limits of that finite mind confer an appearance on that reality.’
– Rupert Spira: ‘The Reality of the Universe Is Prior to Perception’
Contemporary Projects
We were inspired by the work of contemporary across a wide range of practices. ‘Can’t help myself, is a very emotional work, involving a robot arm, attempting to cleaning red paint that keeps spilling. Created by Sun Yuan and Peng Yu, this installation breaks down over time, and as the room gets messier the sense of struggle coming from the robotic system increases and increases. ‘The Clock’ by Christian Marclay is a 24-hour-long montage of thousands of film and television images of clocks, telling the time through a collage of cinematic history. The viewer experiences a vast range of narratives, settings and moods within the space of a few minutes. Similarly, Hannah Lees explored ideas of cycles, constancy, and mortality in her work ‘The Passage of Time’.
Development
Having explored this research and discussed these and other installations and works as a group, we formulated a plan: to create an interactive installation where the audience can engage with universal forces, altering the visuals, music, and soundscapes around them as the tidal forces change. We would need movement sensors, objects or sculptures for the audience to interact with, and a MAX patch to generate the atmosphere with music and visuals in response to the data. We set about making a fictional planetary system. A central water-based planet, with three moons in orbit, the distance of each to the centre we could measure using infra-red distance sensors.
We split into three teams; Design, who made the sculptures and installation visuals, Data, who focused on connecting the infra-red distance sensors through an Arduino into MAX, and Audio, who focused on the sound-design and music. Each team had a specific brief and focus. While Shu designed a sound-effect for each planet: metal, gas, magma, and Fulong designed a responsive wave system, Fraser build a midi-generator in MAX, that would trigger melodies and accompaniment, alongside controlling the overall atmosphere and soundscape in response to the distance data coming from each planet. Meihui wrote the logical MAX sub-patcher that would calculate the total tidal force exerted on the middle planet by the three moon planets, and the resultant direction that force was acting in. With the data flowing into MAX, thanks to the Arduino setup protocol and wiring by Lulu, the final pieces to the installation development were to make the interactive objects, the visual projections, and decide how they would be organised in the room.
Summary notes written by Fraser David Macdonald.
2025.3.1
Before we finalized the design direction and technical logic of the ocean wave sound, we determined the design concept of the ocean wave sound, which will guide our subsequent promotion.
Ocean Wave Sound Design Concept
Tides are a silent dialogue between the universe and the ocean. In this sound design, we turned the speed of the planet into an invisible baton, allowing the breathing of different waves to rise and fall with it. The change in the speed of the planet is like the gentle gesture of gravity, constantly stirring the rhythm of the ocean: when the stars move slower, the sound of the waves is low and low; when the stars move faster, the waves become more turbulent. This metaphorical sound experience poetically presents how tidal forces – this invisible cosmic dance – silently shape the world around us.
The ocean wave sounds we used are as follows:
1.Wave_1
2.Wave_2
3.Wave_3
Designing and creating interaction data calculations and sound and visual interaction logic fell under my role in the development process. In an iterative collaborative process with my teammates, we created an exhibition experience that was multi-sensory, visual, auditory, and interactive.
3/3/2025 – 7/3/2025 | Tidal Force Data Calculation and Logic Design 1
I started by creating the data model because this project relied upon tidal forces as its premise. The formula that I used was:
![]()
The two variables considered were the mass of the planets and the distance from Earth. In order to make this a reality in Max/MSP, I created a customized patch to generate tidal forces in real time.
I first used the rough volume and weight of Mars, the Moon, and Earth to simulate three planets and calculate total tidal force (FR) and direction. I then assigned all planets identical masses to harmonize their sound interaction.
22/3/2025 | Tidal Force Data Calculation and Logic Design 2
I added an extra variable to generate ocean sounds based on planetary motion: movement speed. The patch reads in every 200ms the past and present distance from Earth to another planet, computes their differences, and then divides by interval to approximate speed.
15/3/2025 | Planet Sound Interaction 1
This speed data also came in handy for sound effect triggers such as planet movement sound effects. To aid in simulating immersion, I included a sound effect that, when moving a planet, would trigger a “whoosh” sound. I reused the same speed detection method again (every 200ms). When speed exceeds 0, the sound starts fading in; when speed is reduced to 0, the sound starts fading out immediately. This created a natural, intuitive, motion-based sound effect.
20/3/2025 | Planet Sound Inter
action 2
Fraser then devised a second interaction idea: directly correlating all of the planets’ volumes to the value of tidal force. The group discussed both options and agreed to use Fraser’s “greater force = greater sound” idea. It felt more intuitive and worked more effectively in the exhibition.
25/3/2025 | Ocean Wave Sound Interaction
Following speed calculation, I created a three-phase sound interaction with ocean waves. There is a background sound of waves of low volume at zero speed. The sound of waves becomes more potent as speed increases over the first threshold, coming in more clearly. Upon crossing the second threshold, full-volume waves are heard, producing a powerful audio effect.
25/3/2025 | Visual Particle Interaction 1
This system correctly represented how the user interacted with the planets and facilitated the immersive ocean setting. After completing the initial patch by the visual team that could handle particle motion and RGB-based colour, I added to their work by correlating particle action with tidal force. Particles move quickly under high tidal force and clump together. Particles disperse under low force and move very slowly.
I also tried to symbolize different planets using particle colours – red for fire, white for air, and black for metal. RGB blending, however, turned out to be quite challenging in achieving gradient colours from white to black, so I gave this idea up. I tried to use red, blue, and yellow to differentiate among the three planets later. Even though transitions were more technically sound, usability test results indicated that participants did not understand the colours to symbolize.
1/4/2025 | Visual Particle Interaction 2
As red-blue-yellow was not intuitive to the audience, I also redesigned colour interaction to make them more intuitive. In the eventual release, particle colour represents tidal force strength: weak force = white; stronger force = dark blue. The simple design was much more intuitive for the audience during the exhibition.
2/4/2025 | System Integration and Arduino Testing
As a finishing touch, I combined all elements of interaction. Physical Arduino sensor inputs were routed to Max/MSP. Tidal force and speed were computed and translated to ocean sounds, planetary sound effects, and particle system visualization.
This concluded the entire cycle of interaction: physical action → data input →instant calculation, → audio/visual feedback. It caused the entire system to work fluidly and presented a completely immersive experience for the final performance.
In order to achieve the functions of distance measurement and wireless data transmission at the same time, we finally chose the solution of connecting the ultrasonic sensor using M5StickC Plus. In terms of hardware connection, the VCC, GND, and SIG pins of the Grove ultrasonic sensor are connected to 5V, GND, and GPIO 26 of the M5StickC Plus, respectively.
In actual operation, the ultrasonic sensor is responsible for measuring the distance between the two devices, and the M5StickC Plus reads the distance measurement results and sends them to the computer via UDP protocol and Wi-Fi. The computer runs a Python-based programme that receives the UDP data from the M5StickC Plus, converts it into OSC compliant data, and then transmits it to the Max/MSP patch for interactive control.
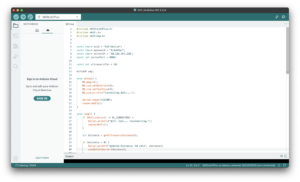
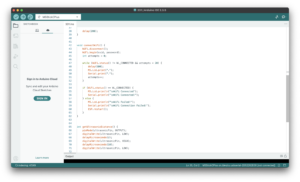
15/03/2025
In actual development, I first wrote and uploaded an Arduino programme for the M5StickC Plus to read the distance data from the Grove ultrasound sensor and transmit it wirelessly to the computer. Wireless transmission is based on the devices being connected to the same Wi-Fi network and communication is accomplished by setting the IP address of the host computer.
Once the data could be transferred, I made certain optimisations according to the actual situation: – Disconnection detection and automatic reconnection: when the Wi-Fi connection is interrupted, the M5StickC Plus screen will display an alert message and automatically try to reconnect to the network;
– Increased data collection frequency: Increase the frequency of sensor readings to make the system more responsive to changes in distance;
– Measuring range limitation and data filtering: according to the actual needs of the device, the effective distance range is limited to 1~200cm, and outliers or invalid data are filtered out;
– Data smoothing: read three distance measurements each time and take their average value to reduce the measurement error and improve the stability and accuracy of the data.
In the Python project, our goal is to receive the UDP data sent from M5StickC Plus, convert it to OSC protocol format, and finally send it to Max/MSP for subsequent processing. To do this, I wrote a Python program that listens on the local IP address (127.0.0.1) to receive the data. Since we are receiving a total of three sets of data, we set up separate UDP listening ports for each set of data, and configured the three OSC receiving ports in the Max project accordingly. In the end, all three sets of data were successfully transmitted through the local network and connected to Max.
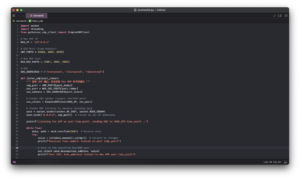
In practice, we also encountered some technical challenges:
Unstable Wi-Fi network: Initially, we tried to connect M5StickC Plus to the mobile phone hotspot, but the connection was frequently disconnected and the communication was unstable. Later, after seeking help from our mentor, we successfully connected M5StickC Plus to the campus Wi-Fi network, which significantly improved the reliability of the connection.
Power supply problem: The M5StickC Plus has a limited built-in battery life, which makes it difficult to support prolonged operation. In order to solve this problem, we have connected a small rechargeable battery to the device, which ensures a continuous and stable power supply.
Sensor Accuracy: The common ultrasonic sensor used initially had a large error in distance measurement, which could not meet the actual needs. After replacing it with the Grove ultrasonic sensor, the measurement results became significantly more stable and accurate, effectively improving the overall reliability of the system.