
ASTROMOVES: Mapping Career Moves of Astrophysicists
With a project title like ASTROMOVES, at some point I have to show a geographic map with overlaid career moves.
This visualization has been much more difficult than anticipated as I learned how to map using Bing and MS Excel, Google Maps, and finally Rstudio.
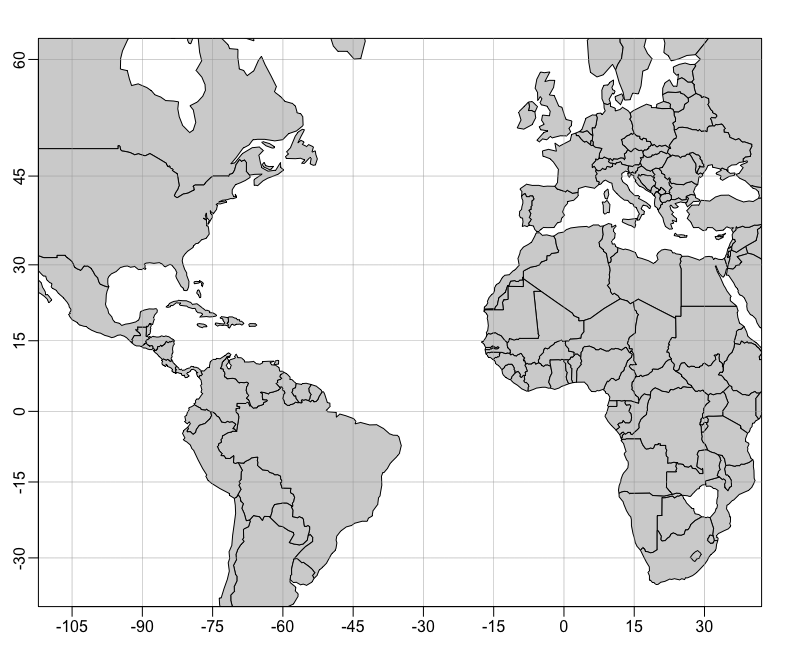
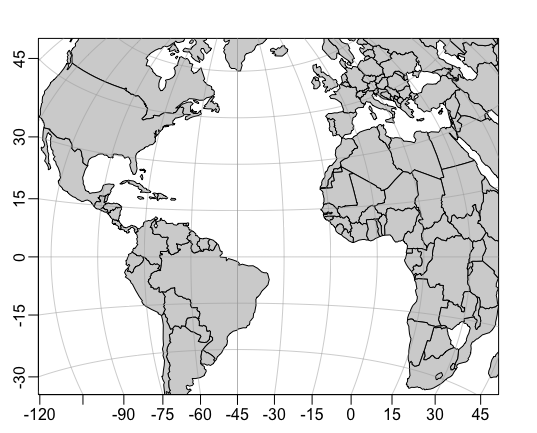
Mercator Projection.
What I wanted was a background map that was not the Mercator projection, which distorts the Northern Hemisphere making it look much larger. Instead I wanted the Peter projection, an equal area map, which shows everything in their correct proportions.
Due to the COVID-19 global pandemic, I was delayed in collecting data, so instead I used a publicly available dataset: the IAU Gruber Fellowships. You can find the list of recipients at https://gruber.yale.edu/international-astronomical-union-fellowships. The IAU Gruber Fellowship is more of a top-up than a fellowship in that it is extra money to help postdocs relocate to a new country, thus it keeps with the mobility theme. The fellows used where those up to 2019.
Using the publicly available data on each fellow, I was able to find the dates, locations and position titles for each of their career moves. Also, I was able to find nationality since the IAU is interested in supporting people from poorer countries. Using MS Excel and their Map function (you might have to add it), the advantage is that you can simply use the names of places and via Bing it recognises places and puts them on the map, without needing exact coordinates.
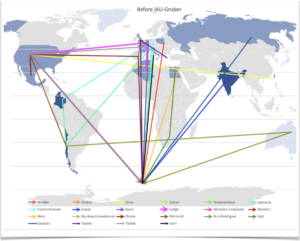
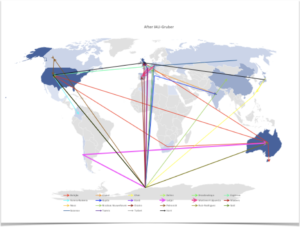
The background map is that generated. Then coordinates were used to plot the lines on top of the map. To the left, the map captures the career moves of the fellows before they received the IAU Gruber. The map on the right is their career moves after accepting the IAU Gruber. On the right, the base map show the most popular locations, in this case the USA and Australia – both powerhouses for observational astronomy. In terms of mapping, to overlay the lines with location points, the coordinates have to be approximated rather than using their longitude and latitude. So much time went into tweaking the x and y values.
Then there is using Google Maps, like the Excel – Bing mapping, place names are recognised, thus plotting points is easy. However, as with the Excel – Bing mapping, connecting the points with lines is inexact. The lines have to be ‘drawn’ on the map, coordinates can’t be used. My research assistant, Sam Duffy, figured this all out, but again it is labor intensive to add all the lines. Also, there is a limit in that only 14 people can be plotted on the same Google map.

The above google map shows the career moves of Romeel Davé with their permission. More problems, definitely the Northern Hemisphere is stretched.
My decision was to learn R in conjunction with learning to make the maps in the style that I wanted! R is freely available as is the easy to use workspace R-Studio. In this case, the names of locations are not recognised so coordinates must be used, however, the coordinates plot on the map correctly. The package used is ‘oce’.
Diving into the world of R and R-studio:
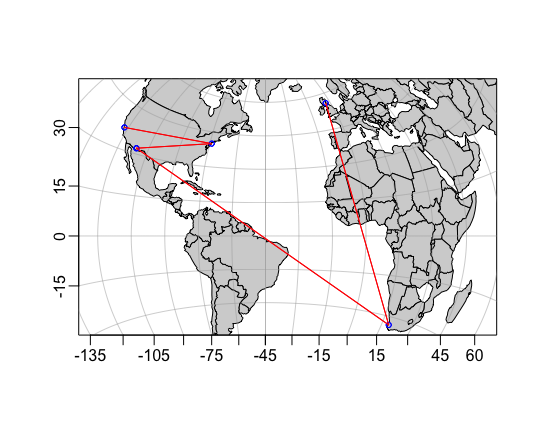
Peter Projection Map.
install.packages(“oce”)
library(oce)
data(coastlineWorld)
cl45 <- coastlineCut(coastlineWorld, lon_0=-45)
par(mar=rep(2, 4))
line <- 0.25
pcol <- “blue”
ecol <- “red”
font <- 2
col <- “lightgray”
Drawing the map:
p <- “+proj=aeqd +lon_0=-45”
mapPlot(coastlineWorld, projection=p,
longitudelim=c(-80,10), latitudelim=c(-35,60), col=col)
Importantly, the type of map projection can be changed via the “projection” option. For Peter this is projection=p, for the Mercator map this is projection=”+proj=merc”.
For overlaying the career moves, the coordinates of locations are used and lines are drawn connecting the locations. Continuing to use Prof Davé’s career moves in R-studio these have to be loaded.
Romeel Davé’s Career Moves plotted using R-Studio on top of Peter Projection Map
>RDave dataset – all the moves that Prof Davé has made for their career.
RDave<- data.frame(
id = c(“PhD”,”1st Postdoc”,”2nd Postdoc”, “1st Faculty”, “2nd Faculty”, “3rd Faculty”),
lon = c(-122, -74, -111, -111, 18.6, -3),
lat = c(37,40,32,32,-33,56),
stringsAsFactors = FALSE)
Then to add these points on top of the Peter Map the mapPoints and mapLines commands:
mapPoints(RDave$lon, RDave$lat, col=”blue”, cex=.7)
mapLines(RDave$lon, RDave$lat, col=”red”)
Moving forward, there is still much to learn about using R! For my research team R is a good language to know if they want to do Data Science in the future, which motivated my choice.
![]()
This project has received funding from the European Union’s Horizon 2020 research and innovation programme under grant agreement No 892944


Recent comments