Mapping the Soundscape- Primary Research 1
Getting started on the project via experimentation and brainstorming ideas.
I felt a bit overwhelmed when I received a file of more than 150 audios, videos and clips and I was a bit confused about from where should I give a start to my project?
To find the point of origin for my project, I decided to narrow down on my project by listening to the audio clips and later copying my favourite sound clips in a separate folder.
I had selected 7 audio clips for my primary research. After selecting them I tried to mix them in different ways and experiment and feel different frequencies and the audibility of different sounds which I had merged together.
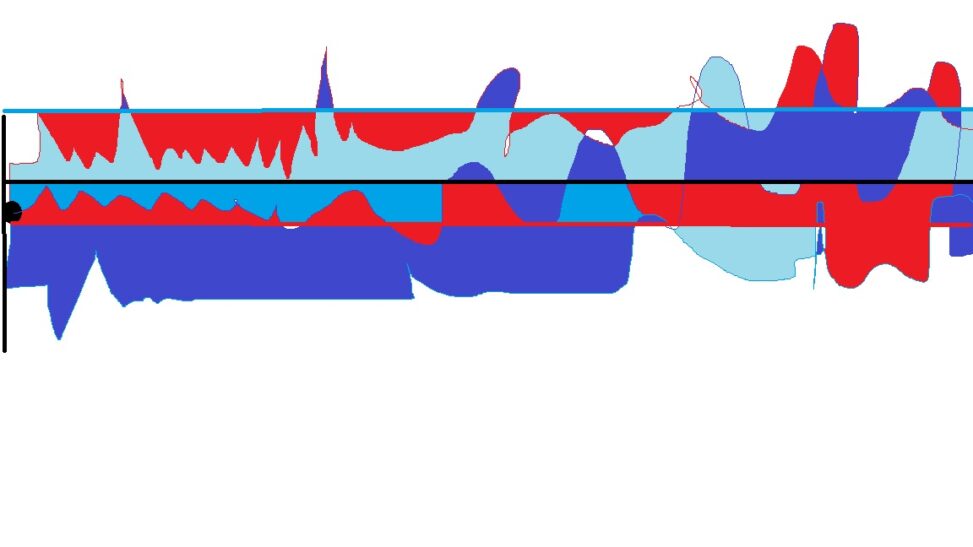
After merging all the audios, I decided to differentiate between the frequencies and wavelengths of the three most dominant sounds of my compilation of the audio clips I had merged.
To do so, I decided to feel the difference between different sounds by drawing the wavelength of each and every sound on a page of an A3 sheet. In order to get a better understanding and to feel even the slightest of difference in wavelengths of a particular sound, I decided to close my eyes and then draw the wavelength of the sound I heard.
To match the speed of the sound with that of my drawing of wavelength, I decided to grab my sketch pen from my fist rather than using my fingers to hold it.


Leave a Reply