The importance of terminology: stationarity or equilibrium?

The importance of terminology: stationarity or equilibrium?
When I began my post-graduate research in 1966, I found that I immediately had to get used to a new terminology. For instance, concepts like homogeneity and isotropy were a definite novelty. In physics one takes these for granted and they are never mentioned. Indeed the opposite is the case, and the occasional instance of inhomogeneity is encountered: I recall that one experiment relied on an inhomogeneity in the magnetic field. Also, in relativity one learns that a light source can only be isotropic in its co-moving frame. In any other frame, in motion relative to it, the source must appear anisotropic, as shown by Lorentz transformation. For the purposes of turbulence theory (and the theory of soft matter), exactly the same consideration must apply to Galilean transformation. Although, to be realistic, Galilean transformations are actually of little value in these fields, as they are normally satisfied trivially [1].

Then there was the transition from statistical physics to, more generally, the subject of statistics. The Maxwell-Boltzmann distribution was replaced by the normal or Gaussian distribution; and, in the case of turbulence, there was the additional complication of a non-Gaussian distribution, with flatness and skewness factors looming large. (I should mention as an aside that the above does not apply to quantum field theory which is pretty much entirely based on the Gaussian distribution.)

Perhaps the most surprising change was from the concept of equilibrium to one of stationarity. In physics, equilibrium means thermal equilibrium. Of course, other examples of equilibrium are sometimes referred to as special cases. For instance, a body may be in equilibrium under forces. But such references are always in context; and the term equilibrium, when used without qualification of this kind, always means thermal equilibrium. So any real fluid flow is a non-equilibrium process, and turbulence is usually classed as far from equilibrium. Indeed, physicists normally seem to regard turbulence as being the archetypal non-equilibrium process.

Unsurprisingly, the term has only rarely been used in turbulence. I can think of references to the approximate balance between production and dissipation near the wall in pipe flow being referred to as equilibrium; but, apart from that, all that comes to mind is Batchelor’s use of the term in connection with the Kolmogorov (1941) theory [2]. This was never widely used by theorists but recently there has been some usage of the term, so I think that it is worth taking a look at what it is; and, more importantly, what it is not.

Batchelor was carrying on the idea of Taylor, that describing homogeneous turbulence in the Fourier representation allowed the topic to be regarded as a part of statistical physics. He argued that the concept of local stationarity that Kolmogorov had introduced could be regarded as local equilibrium, in analogy with thermal equilibrium. The key word here is ‘local’. If we consider a flow that is globally stationary (as nowadays we can, because we have computer simulations), then clearly it would be nonsensical to describe such a flow as being in equilibrium.

However, recently Batchelor’s concept of local equilibrium has been mis-interpreted as being the same as the condition for the existence of an inertial range of wavenumbers, where the flux through wavenumber becomes equal to the dissipation rate. It is important to understand that this concept is not a part of Kolmogorov’s $x$-space theory but is part of the Obukhov-Onsager $k$-space theory. In contrast, the concept of local stationarity can be applied to either picture; but in my view is best avoided altogether.

I will say no more about this topic here, as I intend to develop it over the next few weeks. In particular, I think it would be helpful to make a pointwise summary of Kolmogorov-Obukhov theory, emphasising the differences between $x$-space and $k$-space forms, clarifying the historical position and indicating some significant and more recent developments.

[1] W. D. McComb. Galilean invariance and vertex renormalization. Phys. Rev. E, 71:37301, 2005.
[2] G. K. Batchelor. The theory of homogeneous turbulence. Cambridge University Press, Cambridge, 2nd edition, 1971.


Turbulence in a box.

Turbulence in a box.
When the turbulence theories of Kraichnan, Edwards, Herring, and so on, began attracting attention in the 1960s, they also attracted attention to the underlying ideas of homogeneity, isotropy, and Fourier analysis of the equations of motion. These must have seemed very exotic notions to the fluid dynamicists and engineers who worked on single-point models of the closure problem posed by the Reynolds equation. Particularly, when the theoretical physicists putting forward these new theories had a tendency to write in the language of the relatively new topic of quantum field theory or possibly the even newer statistical field theory. In fact, the only aspect of this new approach that some people working in the field were apparently able to grasp was the fact that the turbulence was in a box, rather than in a pipe or wake or shear layer.

I became aware of this situation when submitting papers in the early 1970s, when I encountered referees who would begin their report with: ‘the author invokes the turbulence in a box concept’. This seemed to me to have ominous overtones. I mean, why comment on it? No one working in the field did: it was taken as quite natural by the theorists. However, in due course it invariably turned out that the referee didn’t think that my paper should be published. Reason? Apparently just the unfamiliarity of the approach. Later on, with the subject of turbulence theory having reached an impasse, they clearly felt quite confident in turning it down. I have written before on my experiences of this kind of refereeing (see, for example, my post of 20 Feb 2020).

Another example of turbulence in a box is the direct numerical simulation of isotropic turbulence, where the Navier-Stokes equations are discretised in a cubical box in terms of a discrete Fourier transform of the velocity field. Since Orszag and Patterson’s pioneering development of the pseudo-spectral method [1] in 1972, the simulation of isotropic turbulence has grown in parallel with the growth of computers; and, in the last few decades, it has become quite an everyday activity in turbulence research. So, now we might expect box turbulence to take its place alongside pipe turbulence, jet turbulence and so on, in the jargon of the subject?

In fact this doesn’t seem to have happened. However, less than twenty years ago, a paper appeared which referred to simulation in a periodic box [2], and since then I have seen references to this in microscopic physics, where the simulations are of molecular systems. I’m not sure why the nature of the box is worth mentioning. It is, after all, a commonplace fact of Fourier analysis, that representation of a non-periodic function in a finite interval requires an assumption of periodic behaviour outside the interval. Much stranger than this is that I am now seeing references to periodic turbulence as, apparently, denoting isotropic turbulence that has been simulated in a periodic box. This does not seem helpful! To most people in the field, periodic turbulence means turbulence that is modulated periodically in time or space. That is, the sort of turbulence that might be found in rotating machinery or perhaps a coherent structure [3]. We have to hope that this usage does not catch on.

[1] S. A. Orszag and G. S. Patterson. Numerical simulation of three-dimensional homogeneous isotropic turbulence. Phys.Rev.Lett, 28:76, 1972.
[2] Y. Kaneda, T. Ishihara, M. Yokokawa, K. Itakura, and A. Uno. Energy dissipation and energy spectrum in high resolution direct numerical simulations of turbulence in a periodic box. Phys. Fluids, 15:L21, 2003.
[3] W. D. McComb. The Physics of Fluid Turbulence. Oxford University Press, 1990.


Large-scale resolution and finite-size effects.

Large-scale resolution and finite-size effects.
This post arises out of the one on local isotropy posted on 21 October 2021; and in particular relates to the comment posted by Alex Liberzon on the need to choose the size of volume $G$ within which Kolmogorov’s assumptions of localness may hold. In fact, as is so often the case, this resolves itself into a practical matter and raises the question of large-scale resolution in both experiment and numerical simulation.

In recent years there has been growing awareness of the need to fully resolve all scales in simulations of isotropic turbulence, with the emphasis initially being on the resolution of the small scales. In my post of 28 October 2021, I presented results from reference [1] showing that compensating for viscous effects and the effects of forcing on the third-order structure function $S_3(r)$ could account for the differences between the four-fifths law and the DNS data at all scales. In this work, the small-scale resolution had been judged adequate using the criteria established by McComb et al [2].

However in [1], we noted that large-scale resolution had only recently received attention in the literature. We ensured that the ratio of box size to integral length-scale (i.e. $L_{box}/L$) was always greater than four. This choice involved the usual trade-off between resolution requirements and the magnitude of Reynolds number achieved, but the results shown in our post of 28 October would indicate that this criterion for large-scale resolution was perfectly adequate. That could suggest that taking $G\sim (4L)^3$ might be a satisfactory criterion. Nevertheless, I think it would be beneficial if someone were to carry out a more systematic investigation of this, in the same way as reference [1] did for the small-scale resolution.

Some attempts have been made at doing this in experimental work on grid turbulence: see the discussion on pages 219-220 in reference [3], but it clearly is a subject that deserves more attention. As a final point, we should note that this topic can be seen as being related to finite-size effects which are nowadays of general interest in microscopic systems, because there the theory actually relies on the system size being infinite. I suppose that we have a similar problem in turbulence in that the derivation of the solenoidal Navier-Stokes equation requires an infinitely large system, as does the use of the Fourier transform.

[1] W. D. McComb, S. R. Yoffe, M. F. Linkmann, and A. Berera. Spectral analysis of structure functions and their scaling exponents in forced isotropic turbulence. Phys. Rev. E, 90:053010, 2014.
[2] W. D. McComb, A. Hunter, and C. Johnston. Conditional mode-elimination and the subgrid-modelling problem for isotropic turbulence. Phys. Fluids, 13:2030, 2001.
[3] W. David McComb. Homogeneous, Isotropic Turbulence: Phenomenology, Renormalization and Statistical Closures. Oxford University Press, 2014.


The second-order structure function corrected for systematic error.

The second-order structure function corrected for systematic error.

In last week’s post, we discussed the corrections to the third-order structure function $S_3(r)$ arising from forcing and viscous effects, as established by McComb et al [1]. This week we return to that reference in order to consider the effect of systematic error on the second-order structure function, $S_2(r)$. We begin with some general definitions.

The longitudinal structure function of order $n$ is defined by:\begin{equation} S_n(r) = \left\langle \delta u^n_L(r) \right\rangle, \end{equation} where $\delta u_L(r)$ is the longitudinal velocity difference over a distance $r$. From purely dimensional arguments we may write: \begin{equation} S_n(r) = C_n \varepsilon^{n/3}\,r^{n/3}, \end{equation} where the $C_n$ are dimensionless constants.
However, as is well known, measured values imply $S_n(r)\sim \, r^{\zeta_n}$ where the exponents $\zeta_n$ are not equal to the dimensional result, with the one exception: $\zeta_3 = 1$. In fact it is found that $\Delta_n = |n/3 – \zeta_n|$ is nonzero and increases with order $n$.

It is worth pausing to consider a question. Does this imply that the measurements give $S_n(r)=C_n \varepsilon^{\zeta_n}r^{\zeta_n}$? No, it doesn’t. Not only would this give the wrong dimensions but, more importantly, the time dimension is controlled entirely by the dissipation rate. Accordingly, we must have: $S_n(r)=C_n \varepsilon^{n/3}r^{\zeta_n}\mathcal{L}^{n/3-\zeta_n}$, where $\mathcal{L}$ is some length scale. Unfortunately for aficionados of intermittency corrections (aka anomalous exponents), the only candidate for this is the size of the system (e.g. $\mathcal{L} = L_{box}$), which leads to unphysical results.

Returning to our main theme, the obvious way of measuring the exponent $\zeta_n$ is to make a log-log plot of $S_n$ against $r$, and determine the local slope: \begin{equation} \zeta_n(r) = d\,\log \,S_n(r)/d\, \log \,r.\end{equation} Then the presence of a plateau would indicate a constant exponent and hence a scaling region. In practice, however, this method has problems. Indeed workers in the field argue that a Taylor-Reynolds number of greater than $R_{\lambda}\sim 500$ is needed for this to work, and of course this is a very high Reynolds number.

A popular way of overcoming this difficulty is the method of extended scale-similarity (or ESS), which relies on the fact that $S_3$ scales with $\zeta_3 =1$ in the inertial range, indicating that one might replace $r$ by $S_3$ as the independent variable, thus: \begin{equation}S_n(r) \sim [S_3(r)]^{\zeta_n^{\ast}},\qquad \mbox{where} \qquad \zeta_n^{\ast} = \zeta_n/\zeta_3.\end{equation} In order to overcome problems with odd-order structural functions, this technique was extended by using the modulus of the velocity difference, to introduce generalized structure functions $G_n(r)$, such that: \begin{equation}G_n(r)=\langle |\delta u_L(r)|^n \rangle\sim r^{\zeta_n’}, \qquad \mbox{with scaling exponents} \quad \zeta’_n. \end{equation} Then, by analogy with the ordinary structure functions, taking $G_3$ with $\zeta’ =1$ leads to \begin{equation} G_n(r) \sim [G_3(r)]^{\Sigma_n}, \qquad\mbox{with} \quad \Sigma_n = \zeta’_n /\zeta’_3 . \end{equation} This technique results in scaling behaviour extending well into the dissipation range which allows exponents to be more easily extracted from the data. Of course, this is in itself an artefact, and this fact should be borne in mind.

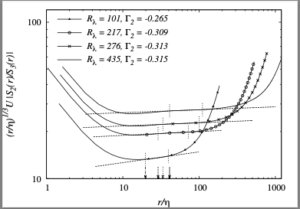
There is an alternative to ESS and that is the pseudospectral method, in which the $S_n$ are obtained from their corresponding spectra by Fourier transformation. This has been used by some workers in the field, and in [1] McComb et al followed their example (see [1] for details) and presented a comparison between this method and ESS. They also applied a standard method for reducing systematic errors to evaluate the exponent of the second-order structure function. This involved considering the ratio $|S_n(r)/S_3(r)|$. In this procedure, an exponent $\Gamma_n$ was defined by \begin{equation}\left | \frac{S_n(r)}{S_3(r)}\right |\sim r^{\Gamma_n}, \qquad \mbox{where} \quad \Gamma_n= \zeta_n – \zeta_3. \end{equation}

Results were obtained only for the case $n=2$ and figures 9 and 10 from [1] are of interest, and are reproduced here. The first of these is the plot of the compensated ratio $(r/\eta)^{1/3}U|S_2(r)/S_3(r)|$ against $r/\eta$, where $\eta$ is the dissipation length scale and $U$ is the rms velocity. This illustrates the way in which the exponents were obtained.


Figure 9 from reference [1].
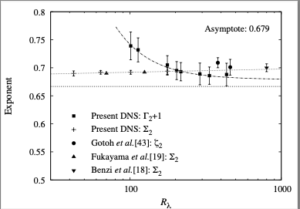
In the second figure, we show the variation of the exponent $\Gamma_2 + 1$ with Reynolds number, compared with the variation of the ESS exponent $\Sigma_2$. It can be seen that the first of these tends towards the K41 value of $2/3$, while the ESS value moves away from the K41 result as the Reynolds number increases.


Figure 10 from reference [1]
Both methods rely on the assumption $\zeta_3 =1$, hence $\Gamma_2+1 = \zeta_2$, which is why we plot that quantity. We may note that figures 1 and 2 point clearly to the existence of finite Reynolds number corrections as the cause of the deviation from K41 values. Further details and discussion can be found in reference [1].

[1] W. D. McComb, S. R. Yoffe, M. F. Linkmann, and A. Berera. Spectral analysis of structure functions and their scaling exponents in forced isotropic turbulence. Phys. Rev. E, 90:053010, 2014.